Des chercheurs d'ESET découvrent des manœuvres frauduleuses s'appuyant sur la popularité de l'outil de modification de visage FaceApp, utilisant une fausse version « Pro » de l'application comme leurre.
The post Avec l’attrait suscité par FaceApp, de nouvelles escroqueries apparaissent appeared first on WeLiveSecurity
Add a sensor and some Python 3 to your Raspberry Pi to keep tabs on your local air pollution, in the project taken from Hackspace magazine issue 21.
Air is the very stuff we breathe. It’s about 78% nitrogen, 21% oxygen, and 1% argon, and then there’s the assorted ‘other’ bits and pieces – many of which have been spewed out by humans and our related machinery. Carbon dioxide is obviously an important polluter for climate change, but there are other bits we should be concerned about for our health, including particulate matter. This is just really small bits of stuff, like soot and smog. They’re grouped together based on their size – the most important, from a health perspective, are those that are smaller than 2.5 microns in width (known as PM2.5), and PM10, which are between 10 and 2.5 microns in width. This pollution is linked with respiratory illness, heart disease, and lung cancer.
Obviously, this is something that’s important to know about, but it’s something that – here in the UK – we have relatively little data on. While there are official sensors in most major towns and cities, the effects can be very localised around busy roads and trapped in valleys. How does the particular make-up of your area affect your air quality? We set out to monitor our environment to see how concerned we should be about our local air.
We picked the SDS011 sensor for our project (see ‘Picking a sensor’ below for details on why). This sends output via a binary data format on a serial port. You can read this serial connection directly if you’re using a controller with a UART, but the sensors also usually come with a USB-to-serial connector, allowing you to plug it into any modern computer and read the data.
The USB-to-serial connector makes it easy to connect the sensor to a computer
The very simplest way of using this is to connect it to a computer. You can read the sensor values with software such as DustViewerSharp. If you’re just interested in reading data occasionally, this is a perfectly fine way of using the sensor, but we want a continuous monitoring station – and we didn’t want to leave our laptop in one place, running all the time. When it comes to small, low-power boards with USB ports, there’s one that always springs to mind – the Raspberry Pi.
First, you’ll need a Raspberry Pi (any version) that’s set up with the latest version of Raspbian, connected to your local network, and ideally with SSH enabled. If you’re unsure how to do this, there’s guidance on the Raspberry Pi website.
![]()
The wiring for this project is just about the simplest we’ll ever do: connect the SDS011 to the Raspberry Pi with the serial adapter, then plug the Raspberry Pi into a power source.
Before getting started on the code, we also need to set up a data repository. You can store your data wherever you like – on the SD card, or upload it to some cloud service. We’ve opted to upload it to Adafruit IO, an online service for storing data and making dashboards. You’ll need a free account, which you can sign up for on the Adafruit IO website – you’ll need to know your Adafruit username and Adafruit IO key in order to run the code below. If you’d rather use a different service, you’ll need to adjust the code to push your data there.
We’ll use Python 3 for our code, and we need two modules – one to read the data from the SDS011 and one to push it to Adafruit IO. You can install this by entering the following commands in a terminal:
pip3 install pyserial adafruit-io
You’ll now need to open a text editor and enter the following code:

This does a few things. First, it reads ten bytes of data over the serial port – exactly ten because that’s the format that the SDS011 sends data in – and sticks these data points together to form a list of bytes that we call data.
![]()
We’re interested in bytes 2 and 3 for PM2.5 and 4 and 5 for PM10. We convert these from bytes to integer numbers with the slightly confusing line:
pmtwofive = int.from_bytes(b’’.join(data[2:4]), byteorder=’little’) / 10
from_byte command takes a string of bytes and converts them into an integer. However, we don’t have a string of bytes, we have a list of two bytes, so we first need to convert this into a string. The b’’ creates an empty string of bytes. We then use the join method of this which takes a list and joins it together using this empty string as a separator. As the empty string contains nothing, this returns a byte string that just contains our two numbers. The byte_order flag is used to denote which way around the command should read the string. We divide the result by ten, because the SDS011 returns data in units of tens of grams per metre cubed and we want the result in that format aio.send is used to push data to Adafruit IO. The first command is the feed value you want the data to go to. We used kingswoodtwofive and kingswoodten, as the sensor is based in Kingswood. You might want to choose a more geographically relevant name. You can now run your sensor with:
python3 airquality.py
…assuming you called the Python file airquality.py
and it’s saved in the same directory the terminal’s in.
![]()
At this point, everything should work and you can set about running your sensor, but as one final point, let’s set it up to start automatically when you turn the Raspberry Pi on. Enter the command:
crontab -e
…and add this line to the file:
@reboot python3 /home/pi/airquality.py
With the code and electronic setup working, your sensor will need somewhere to live. If you want it outside, it’ll need a waterproof case (but include some way for air to get in). We used a Tupperware box with a hole cut in the bottom mounted on the wall, with a USB cable carrying power out via a window. How you do it, though, is up to you.
Now let’s democratise air quality data so we can make better decisions about the places we live.
There are a variety of particulate sensors on the market. We picked the SDS011 for a couple of reasons. Firstly, it’s cheap enough for many makers to be able to buy and build with. Secondly, it’s been reasonably well studied for accuracy. Both the hackAIR and InfluencAir projects have compared the readings from these sensors with more expensive, better-tested sensors, and the results have come back favourably. You can see more details at hsmag.cc/DiYPfg and hsmag.cc/Luhisr.
The one caveat is that the results are unreliable when the humidity is at the extremes (either very high or very low). The SDS011 is only rated to work up to 70% humidity. If you’re collecting data for a study, then you should discard any readings when the humidity is above this. HackAIR has a formula for attempting to correct for this, but it’s not reliable enough to neutralise the effect completely. See their website for more details: hsmag.cc/DhKaWZ.
Once you’re monitoring your PM2.5 data, what should you look out for? The World Health Organisation air quality guideline stipulates that PM2.5 not exceed 10 µg/m3 annual mean, or 25 µg/m324-hour mean; and that PM10 not exceed 20 µg/m3 annual mean, or 50 µg/m3 24-hour mean. However, even these might not be safe. In 2013, a large survey published in The Lancet “found a 7% increase in mortality with each 5 micrograms per cubic metre increase in particulate matter with a diameter of 2.5 micrometres (PM2.5).”
Standard advice for locating your sensor is that it should be outside and four metres above ground level. That’s good advice for general environmental monitoring; however, we’re not necessarily interested in general environmental monitoring – we’re interested in knowing what we’re breathing in.
Locating your monitor near your workbench will give you an idea of what you’re actually inhaling – useless for any environmental study, but useful if you spend a lot of time in there. We found, for example, that the glue gun produced huge amounts of PM2.5, and we’ll be far more careful with ventilation when using this tool in the future.
You can use any data platform you like. We chose Adafruit IO because it’s easy to use, lets you share visualisations (in the form of dashboards) with others, and connects with IFTTT to perform actions based on values (ours tweets when the air pollution is above legal limits).
One thing to be aware of is that Adafruit IO only holds data for 30 days (on the free tier at least). If you want historical data, you’ll need to sign up for the Plus option (which stores data for 60 days), or use an alternative storage method. You can use multiple data stores if you like.
Now you’ve got your monitoring station up and running, how do you know that it’s running properly? Perhaps there’s an issue with the sensor, or perhaps there’s a problem with the code. The easiest method of calibration is to test it against an accurate sensor, and most cities here in the UK have monitoring stations as part of Defra’s Automatic Urban and Rural Monitoring Network. You can find your local station here. Many other countries have equivalent public networks. Unless there is no other option, we would caution against using crowdsourced data for calibration, as these sensors aren’t themselves calibrated.
With a USB battery pack, you can head to your local monitoring point and see if your monitor is getting similar results to the monitoring network.
You can read the rest of this feature in HackSpace magazine issue 21, out today in Tesco, WHSmith, and all good independent UK newsagents.
Or you can buy HackSpace mag directly from us — worldwide delivery is available. And if you’d like to own a handy digital version of the magazine, you can also download a free PDF.
The post Monitor air quality with a Raspberry Pi appeared first on Raspberry Pi.
À ce jour, combien de systèmes Internet, et dans quels pays et industries, demeurent vulnérables à Bluekeep?
The post Le correctif contre BlueKeep ne progresse pas assez vite appeared first on WeLiveSecurity
En suivant les activités malveillantes de l’insaisissable groupe APT Ke3chang, les chercheurs d'ESET ont découvert de nouvelles versions de familles de logiciels malveillants liées au groupe, ainsi qu'une porte dérobée non signalée
The post Okrum : Le groupe Ke3chang cible les missions diplomatiques appeared first on WeLiveSecurity
I need to disable SELinux on CentOS 7. How can I disable SELinux from the command line over ssh based session?
The post Disable SELinux on CentOS 7 / RHEL 7 / Fedora Linux appeared first on nixCraft.
You too can recreate the techniques behind a pioneering 3D maze game in Python. Mark Vanstone explains how.
3D Monster Maze, released in 1982 by J.K. Greye software, written by Malcolm Evans.
While 3D games have become more and more realistic, some may forget that 3D games on home computers started in the mists of time on machines like the Sinclair ZX81. One such pioneering game took pride of place in my collection of tapes, took many minutes to load, and required the 16K RAM pack expansion. That game was 3D Monster Maze — perhaps the most popular game released for the ZX81.
The game was released in 1982 by J.K. Greye Software, and written by Malcolm Evans. Although the graphics were incredibly low resolution by today’s standards, it became an instant hit. The idea of the game was to navigate around a randomly generated maze in search of the exit.
The problem was that a Tyrannosaurus rex also inhabited the maze, and would chase you down and have you for dinner if you didn’t escape quickly enough. The maze itself was made of straight corridors on a 16×18 grid, which the player would move around from one block to the next. The shape of the blocks were displayed by using the low-resolution pixels included in the ZX81’s character set, with 2×2 pixels per character on the screen.
The original ZX81 game drew its maze from chunky 2×2 pixel blocks.
There’s an interesting trick to recreating the original game’s 3D corridor display which, although quite limited, works well for a simplistic rendering of a maze. To do this, we need to draw imaginary lines diagonally from corner to corner in a square viewport: these are our vanishing point perspective guides. Then each corridor block in our view is half the width and half the height of the block nearer to us.
If we draw this out with lines showing the block positions, we get a view that looks like we’re looking down a long corridor with branches leading off left and right. In our Pygame Zero version of the maze, we’re going to use this wireframe as the basis for drawing our block elements. We’ll create graphics for blocks that are near the player, one block away, two, three, and four blocks away. We’ll need to view the blocks from the left-hand side, the right-hand side, and the centre.
The maze display is made by drawing diagonal lines to a central vanishing point.
Once we’ve created our block graphics, we’ll need to make some data to represent the layout of the maze. In this example, the maze is built from a 10×10 list of zeros and ones. We’ll set a starting position for the player and the direction they’re facing (0–3), then we’re all set to render a view of the maze from our player’s perspective.
The display is created from furthest away to nearest, so we look four blocks away from the player (in the direction they’re looking) and draw a block if there’s one indicated by the maze data to the left; we do the same on the right, and finally in the middle. Then we move towards the player by a block and repeat the process (with larger graphics) until we get to the block the player is on.
Each visible block is drawn from the back forward to make the player’s view of the corridors.
That’s all there is to it. To move backwards and forwards, just change the position in the grid the player’s standing on and redraw the display. To turn, change the direction the player’s looking and redraw. This technique’s obviously a little limited, and will only work with corridors viewed at 90-degree angles, but it launched a whole genre of games on home computers. It really was a big deal for many twelve-year-olds — as I was at the time — and laid the path for the vibrant, fast-moving 3D games we enjoy today.
Here’s Mark’s code, which recreates 3D Monster Maze’s network of corridors in Python. To get it running on your system, you’ll need to install Pygame Zero. And to download the full code, visit our Github repository here.
You can read more features like this one in Wireframe issue 18, available now at Tesco, WHSmith, and all good independent UK newsagents.
Or you can buy Wireframe directly from Raspberry Pi Press — delivery is available worldwide. And if you’d like a handy digital version of the magazine, you can also download issue 18 for free in PDF format.
![]()
Make sure to follow Wireframe on Twitter and Facebook for updates and exclusive offers and giveaways. Subscribe on the Wireframe website to save up to 49% compared to newsstand pricing!
The post Recreate 3D Monster Maze’s 8-bit labyrinth | Wireframe issue 18 appeared first on Raspberry Pi.
Un chercheur a découvert qu'il était possible de subvertir le mécanisme de récupération des mots de passe de la plateforme et de prendre le contrôle des comptes d'utilisateurs.
The post Comment votre compte Instagram aurait pu être piraté appeared first on WeLiveSecurity
As their new YouTube video shows, the team at T3ch Flicks have been hard at work, designing and prototyping a smart buoy for marine conservation research.
Smart-Buoy Series [Summary]
We all love the seaside, right? Whether that’s the English seaside with ice creams and muddy piers or the Caribbean, with white sand beaches fringed by palm trees, people flock to the coast for a bit of rest and relaxation, to enjoy water sports or to make their livelihood.
“The sensors onboard the smart buoy enable it to measure wave height, wave period, wave power, water temperature, air temperature, air pressure, voltage, current usage and GPS location,” explain T3ch Flicks on their project tutorial page. “All the data the buoy collects is sent via radio to a base station, which is a Raspberry Pi. We made a dashboard to display them using Vue JS.”
But why build a smart buoy to begin with? “The coast is a dynamic area at the mercy of waves. Rising sea levels nibble at beaches and powerful extreme events like hurricanes completely decimate them,” they go on to explain. “To understand how to save them, we need to understand the forces driving their change.”
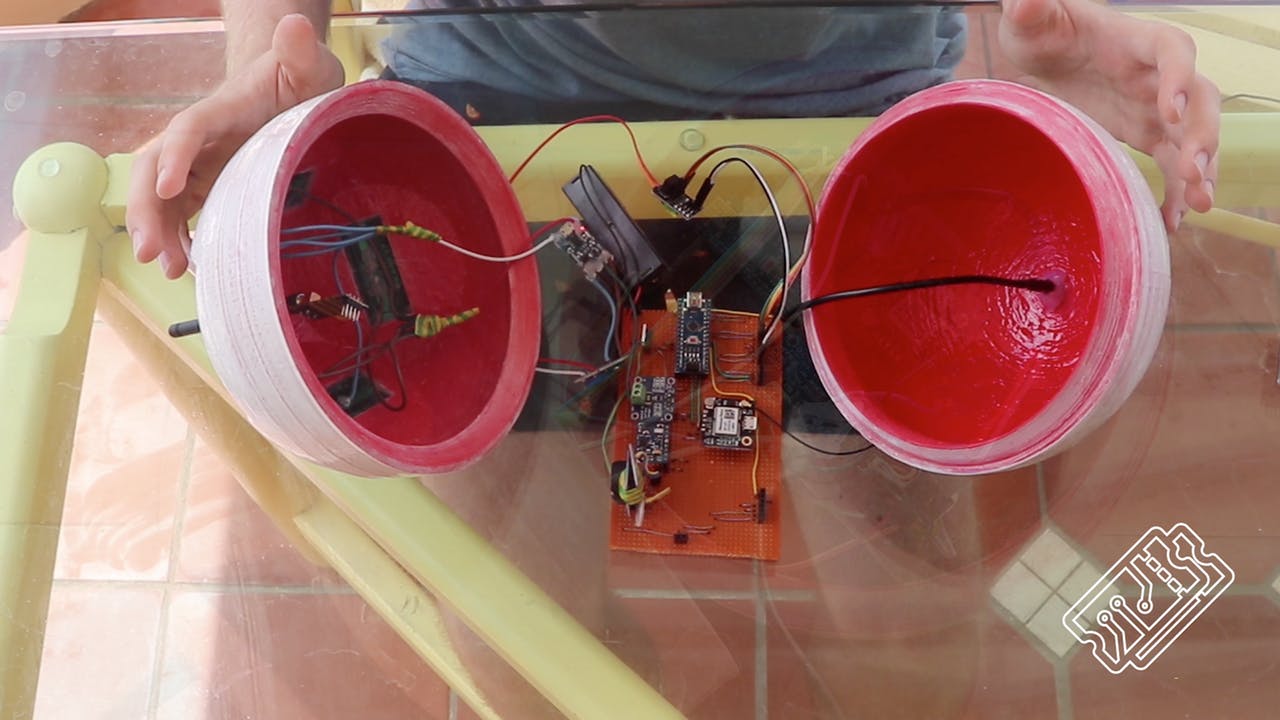
It’s a pretty big ask of a 3D-printed dome but, with the aid of an on-board Raspberry Pi, Arduino and multiple sensors, their project was a resounding success. So much so that the Grenadian government gave the team approval to set the buoy free along their coast, and even made suggestions of how the project could be improved to aid them in their own research – pretty cool, right?

The project uses a lot of tech. A lot. So, instead of listing it here, why not head over to the hackster.io project page, where you’ll find all the ingredients you need to build your own smart buoy.
Good luck to the T3ch Flicks team. We look forward to seeing how the project develops.
The post Good Buoy: the Raspberry Pi Smart Buoy appeared first on Raspberry Pi.
This isn’t the first mineral oil bath we’ve seen for the Raspberry Pi, but it’s definitely the first we’ve seen with added fish tank decorations.
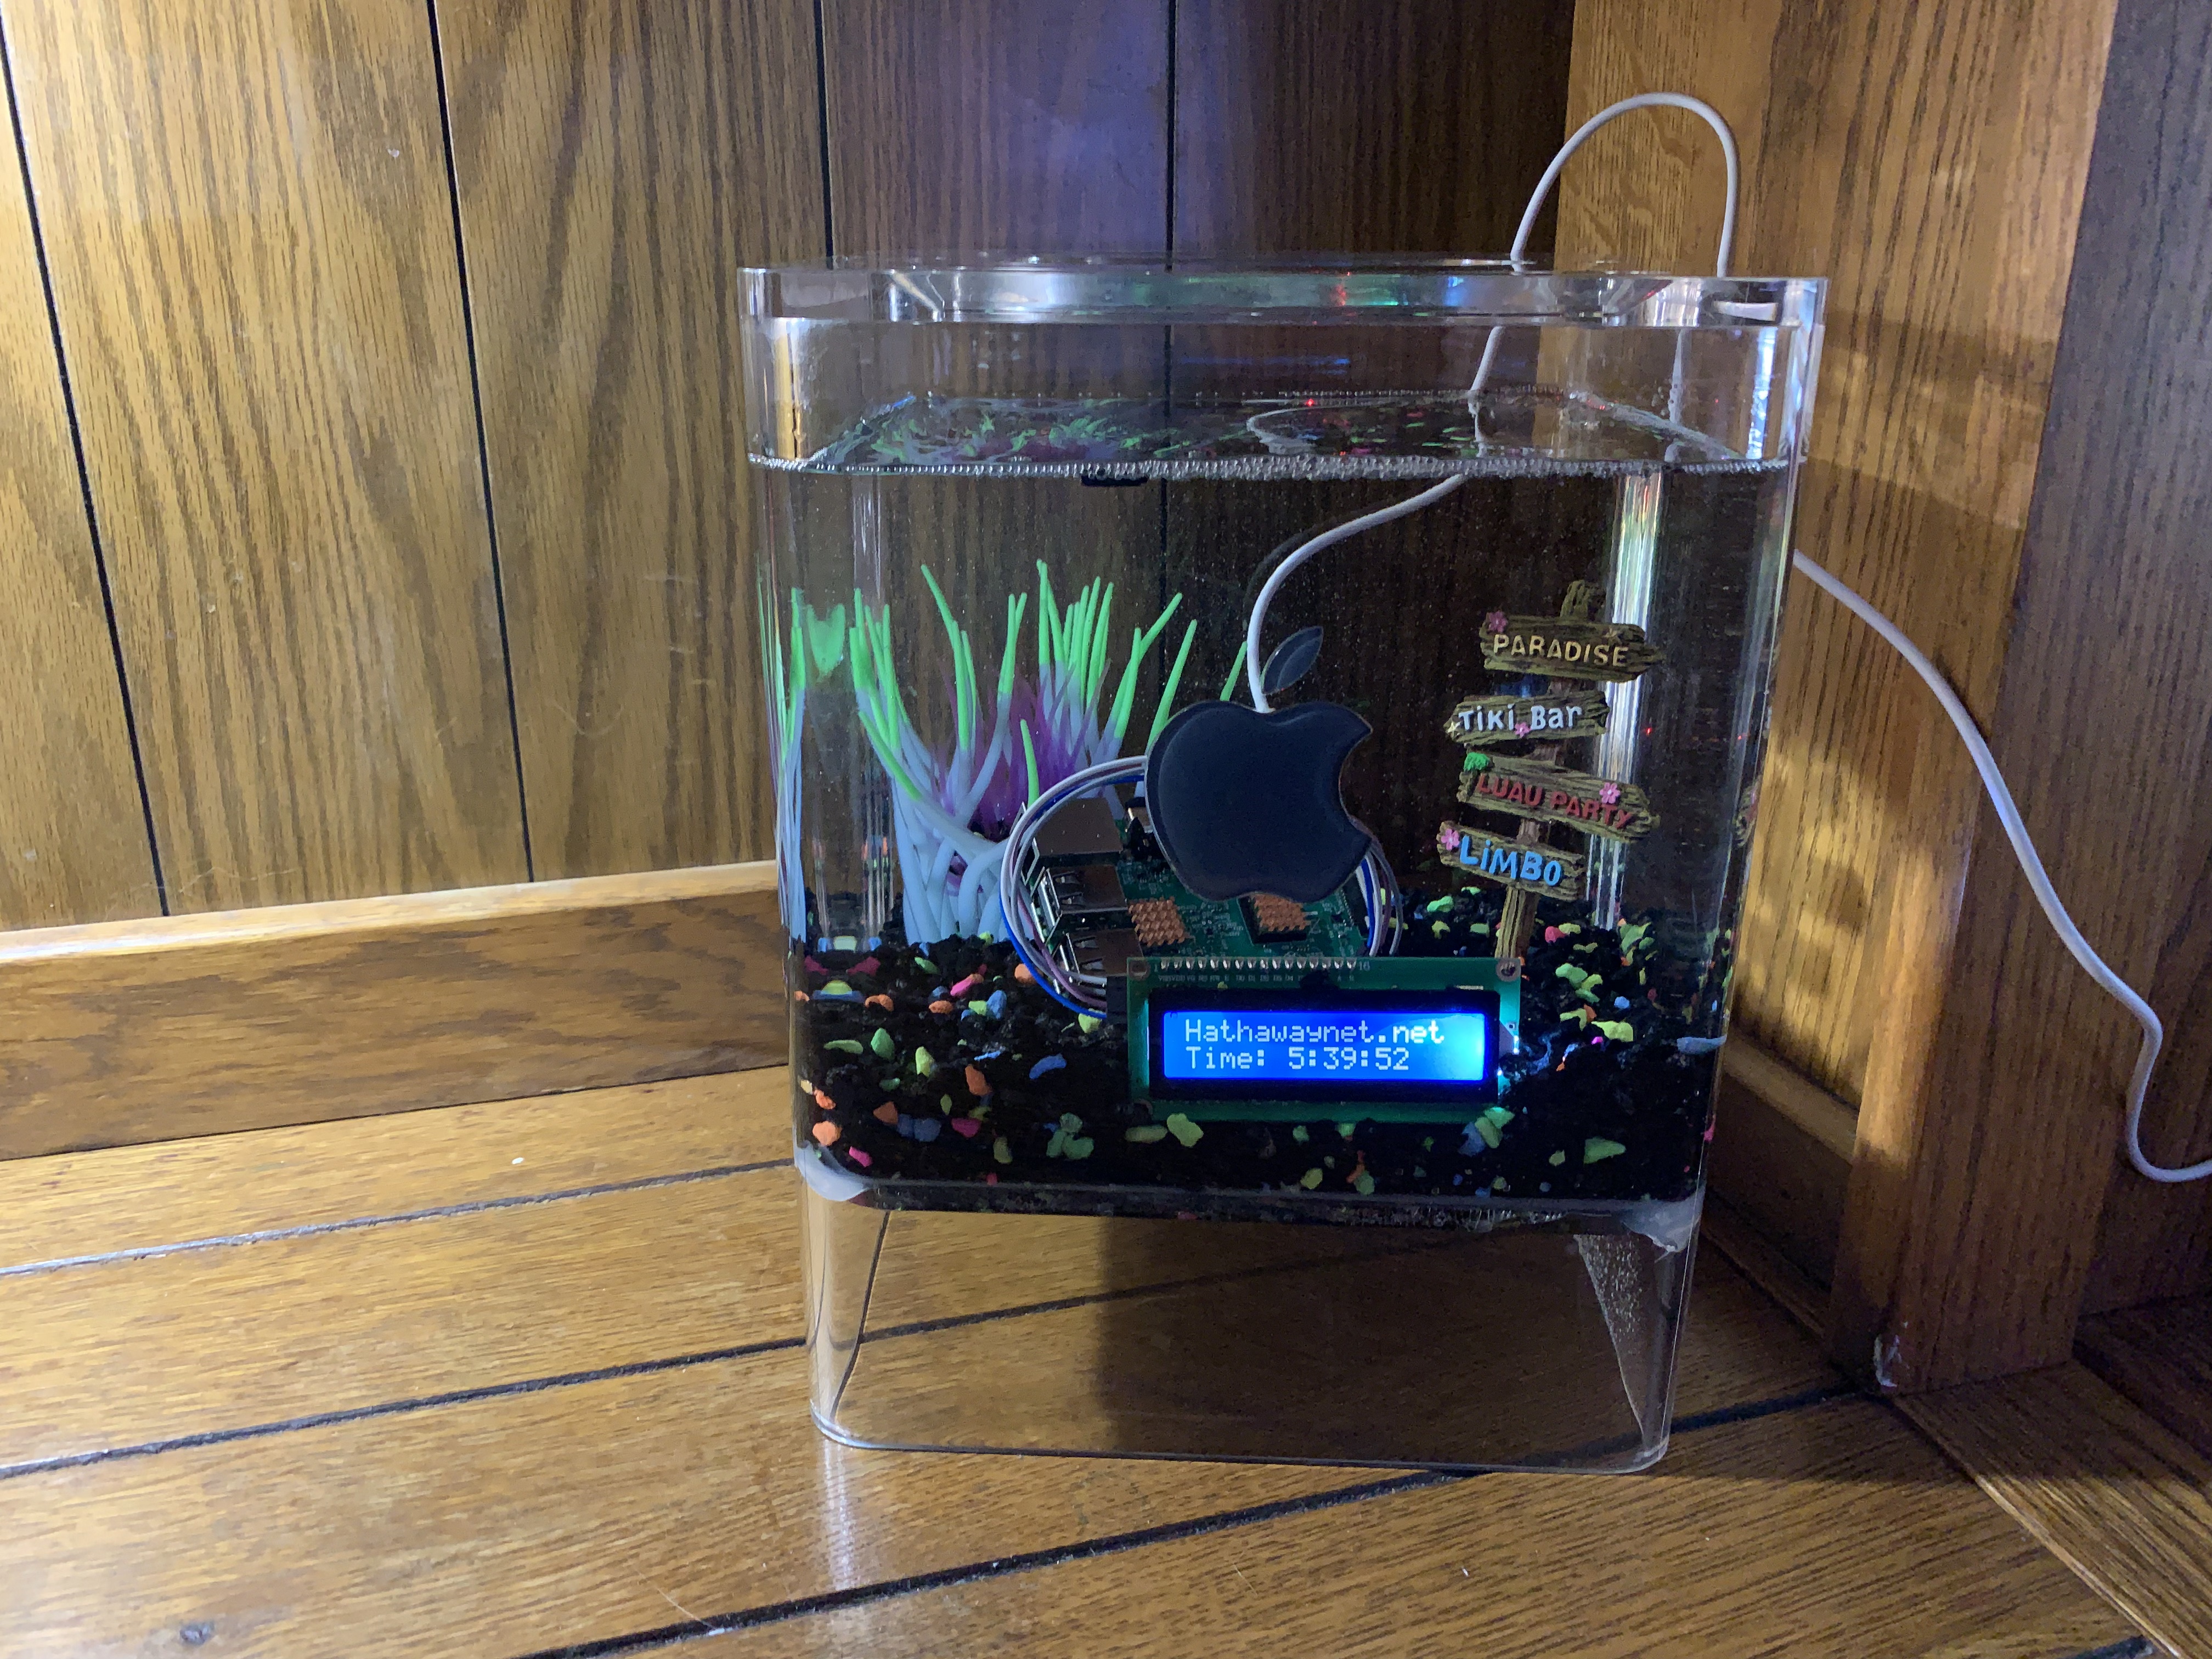
Using the see-through casing of an old Apple PowerMac G4, Reddit user u/mjh2901 decided to build a mineral oil tank for their Raspberry Pi, and it looks fabulous. Renamed Apple Pi, this use of mineral oil is a technique used by some to manage the heat produced by tech. Oil is able to transfer heat up to five times more efficiently than air, with some mineral oil projects using a separate radiator to dissipate the heat back into the air.
So, how did they do it?
“Started with a PowerMac G4 case I previously used as a fish tank, then a candy dish. I had cut a piece of acrylic and glued it into the bottom.”
They then placed a Raspberry Pi 3 attached to a 2-line 16 character LCD into the tank, along with various decorations, and began to fill with store-bought mineral oil. Once full, the project was complete, the Raspberry Pi forever submerged.
You can find more photos here. But, one question still remains…
…who would use an old fish tank as a candy bowl?! ![]()
The post Raspberry Pi mineral oil tank with added pizzazz appeared first on Raspberry Pi.
How do I install a LAMP stack on Debian 10 (Buster)?
The post How to install LAMP on Debian 10 (Buster) appeared first on nixCraft.
Hack your existing Raspberry Pi case to fit the layout of your new Raspberry Pi 4, with this handy “How to hack your existing Raspberry Pi case to fit the layout of your new Raspberry Pi 4” video!
Hack your old Raspberry Pi case to fit your Raspberry Pi 4
Hack your existing official Raspberry Pi case to fit the new Raspberry Pi 4, or treat yourself to the new official Raspberry Pi 4 case. The decision is yours!
The post Hack your old Raspberry Pi case for the Raspberry Pi 4 appeared first on Raspberry Pi.
How do I remove and delete a UFW firewall rule running on Ubuntu or Debian Linux?
The post How to delete a UFW firewall rule on Ubuntu / Debian Linux appeared first on nixCraft.
I am a new Debian Linux 10 server user. How do I set up an OpenVPN Server on Debian Linux version 10 server to shield my browsing activity from bad guys on public Wi-Fi, and more?
The post Debian 10 Set Up OpenVPN Server In 5 Minutes appeared first on nixCraft.
Ce que l'inquiétude croissante du public à l'égard des victimes de la cybercriminalité révèle au sujet des efforts du gouvernement et des entreprises en matière de dissuasion de la cybercriminalité.
The post La cybercriminalité semble s’aggraver : il est temps d’agir appeared first on WeLiveSecurity
How do I change the hostname of a Debian Linux 10 "Buster" operating system permanently using the command line tools?
The post How to change hostname on Debian 10 Linux appeared first on nixCraft.
Have you ever witnessed something marvellous but, by the time you get your camera out to record it, the moment has passed? Johan Link‘s Film in the Past hat-mounted camera is here to save the day!
As 18-year-old student Johan explains, “Imagine you are walking in the street and you see a meteorite in the sky – obviously you don’t have time to take your phone to film it.” While I haven’t seen many meteorites in the sky, I have found myself wishing I’d had a camera to hand more than once in my life – usually when a friend trips over or says something ridiculous. “Fortunately after the passage of the meteorite, you just have to press a button on the hat and the camera will record the last 7 seconds”, Johan continues. “Then you can download the video from an application on your phone.”
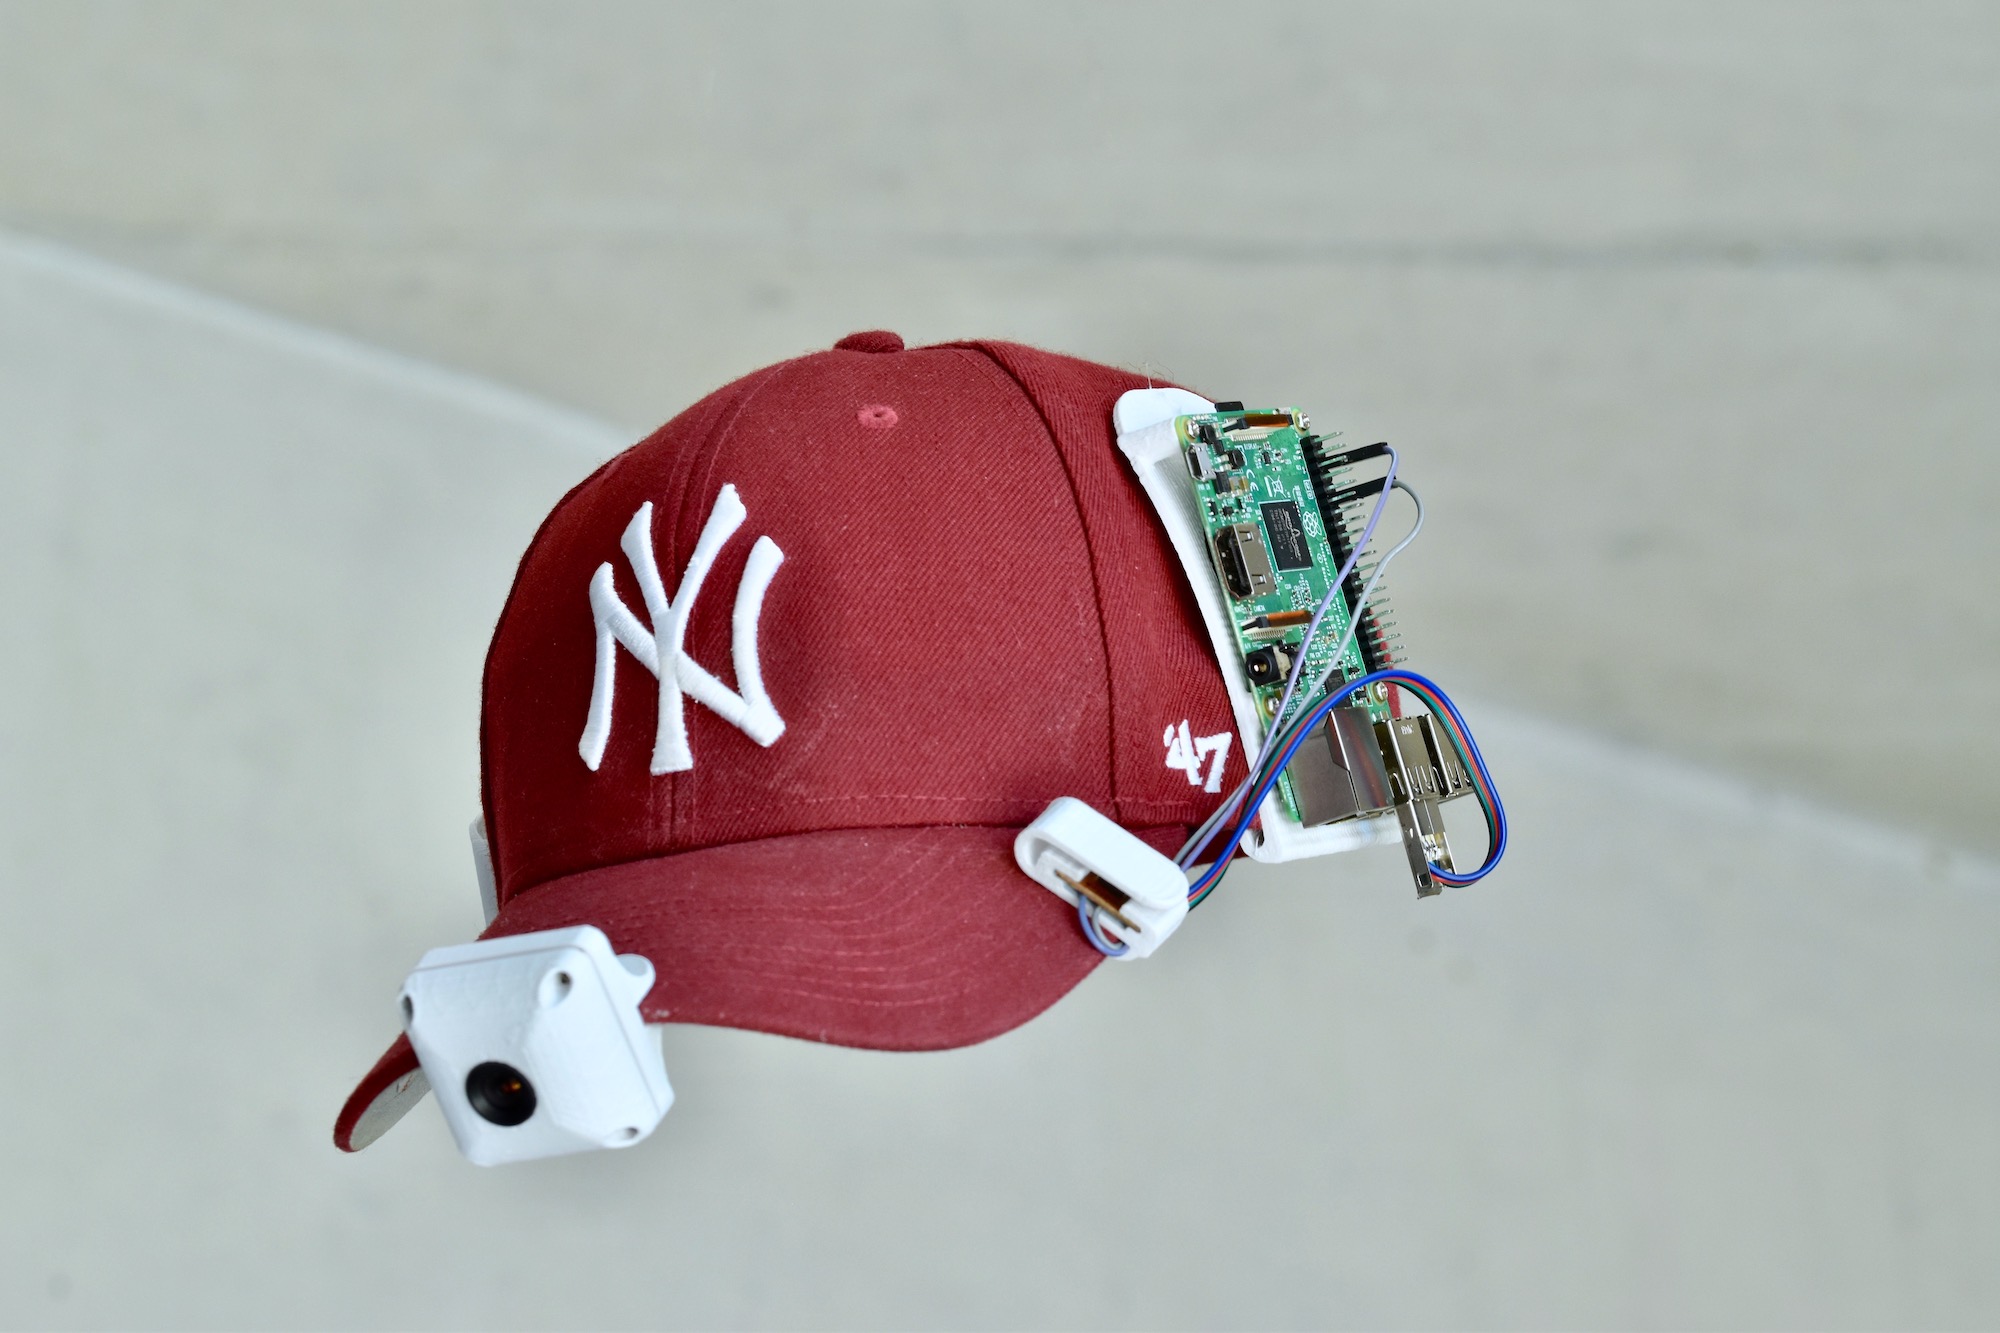
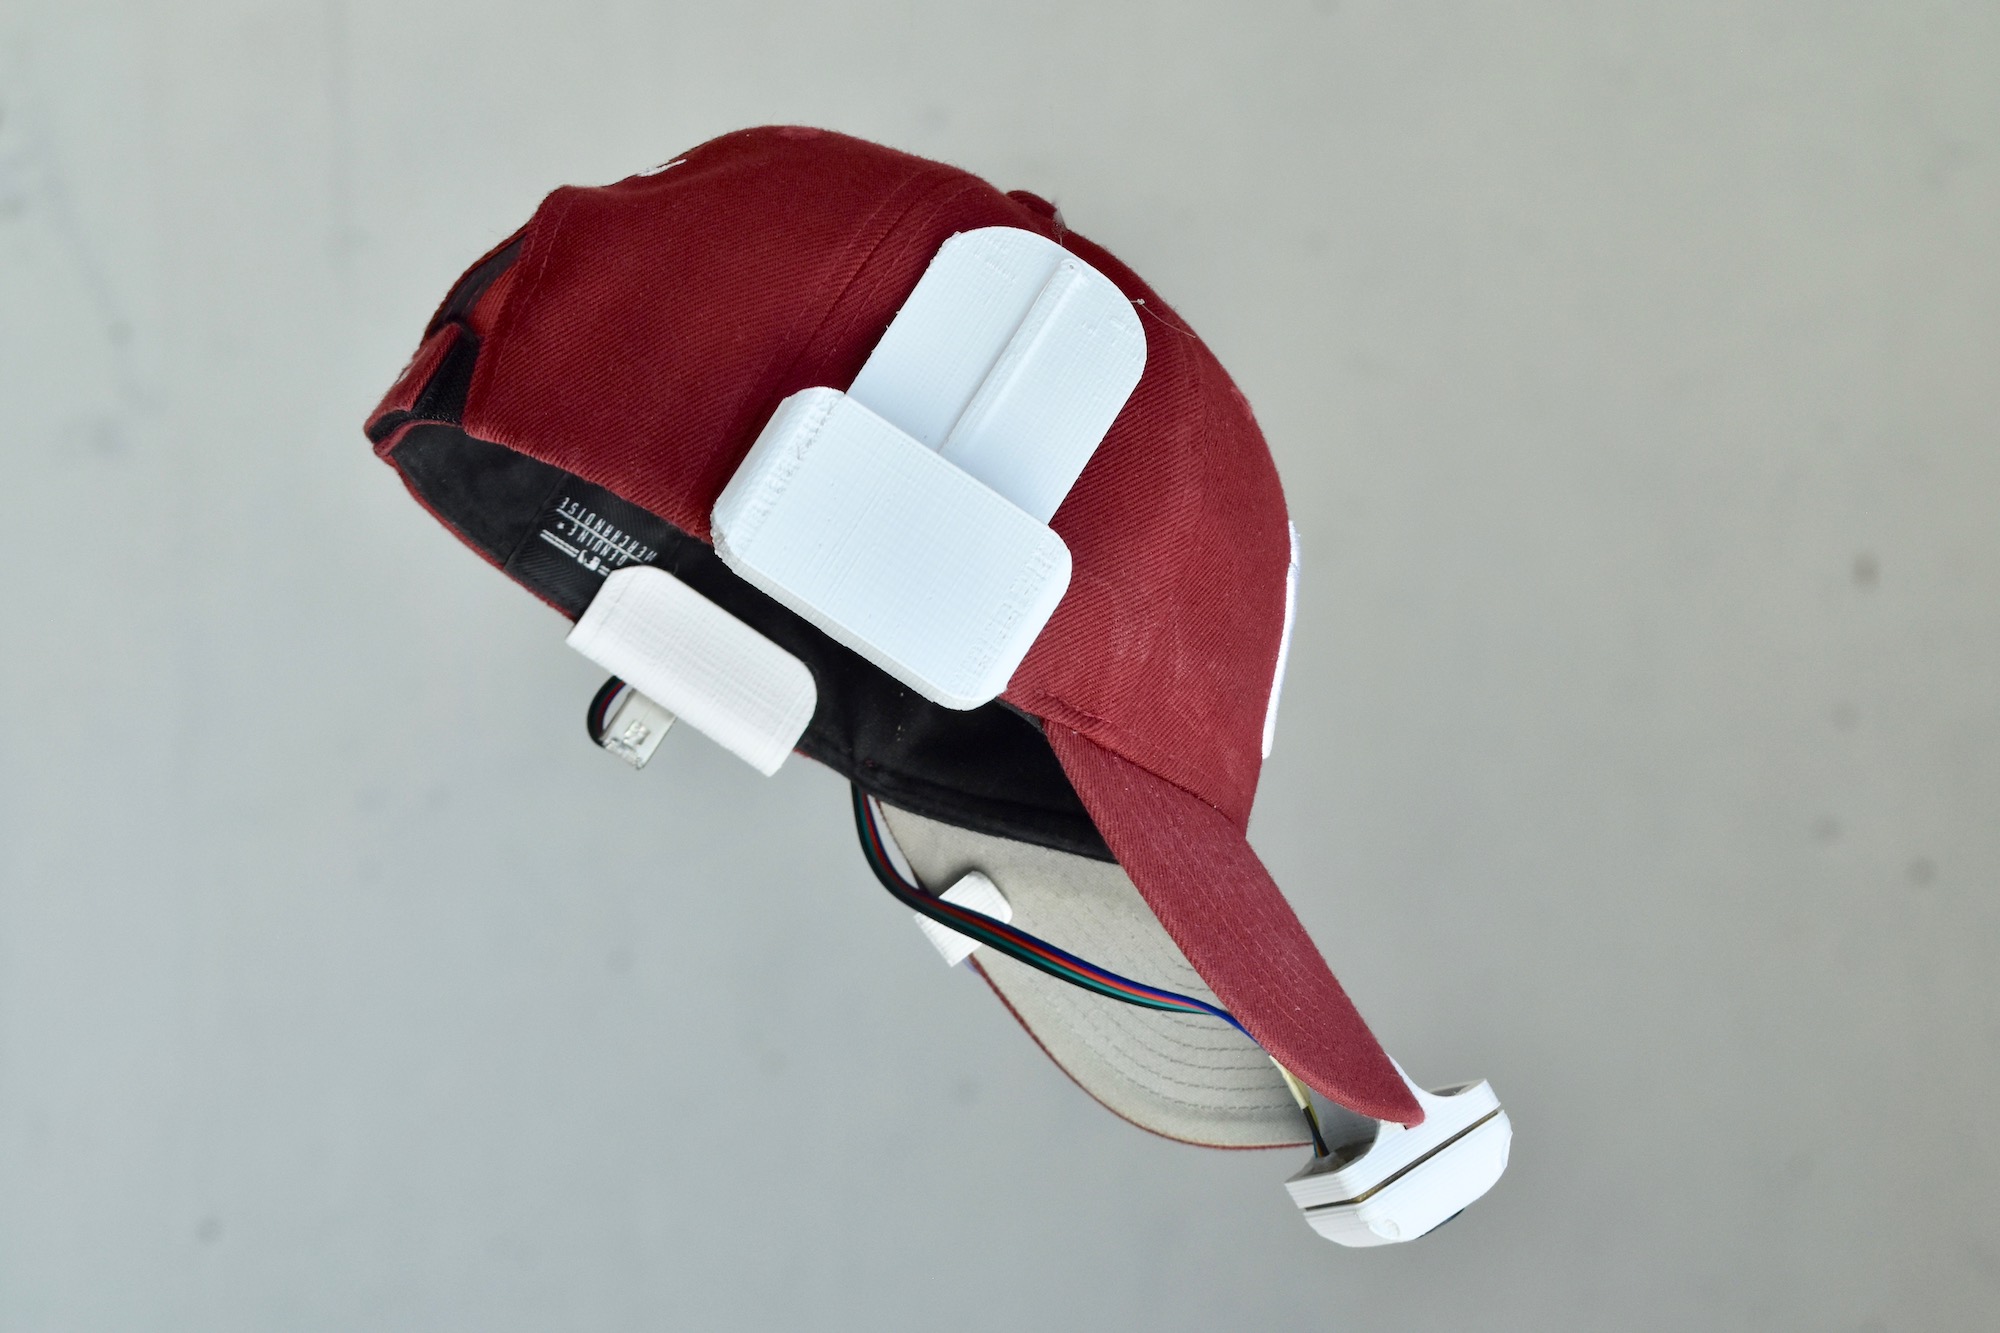
Johan’s project, Film in the Past, consists of a Raspberry Pi 3 with USB camera attached, mounted to the peak of a baseball cap.
The camera is always on, and, at the press of a button, will save the last seven seconds of footage to the Raspberry Pi. You can then access the saved footage from an application on your smartphone. It’s a bit like the video capture function on the Xbox One or, as I like to call it, the option to record hilarious glitches during gameplay. But, unlike the Xbox One, it’s a lot easier to get the footage off the Raspberry Pi and onto your phone.
Fancy building your own? The full Python code for the project can be downloaded via GitHub, and more information can be found on Instructables and Johan’s website.
The post Record the last seven seconds of everything you see appeared first on Raspberry Pi.
I have Debian 9.x installed on AWS EC2. How do I upgrade Debian 9 Stretch to Debian 10 Buster using the apt command/apt-get command CLI? How can I upgrade Debian 9 to Debian 10 using ssh client?
The post How to upgrade Debian 9 to Debian 10 Buster using the CLI appeared first on nixCraft.
Les recherches d'ESET révèlent qu'un groupe criminel notoire a mené des campagnes d'espionnage au cours des cinq dernières années.
The post Buhtrap utilise un jour zéro pour des campagnes d’espionnage appeared first on WeLiveSecurity
How do I install vnstat network traffic monitor on Fedora Linux system to monitor my hourly, daily, weekly, and monthly bandwidth usage?
The post Fedora Linux install vnstat network traffic monitor appeared first on nixCraft.
The libbloom package prior to version 1.6-2 was missing a soname link. This has been fixed in 1.6-2, so the upgrade will need to overwrite the untracked soname link created by ldconfig. If you get an error
libbloom: /usr/lib/libbloom.so.1 exists in filesystem
when updating, use
pacman -Suy --overwrite usr/lib/libbloom.so.1
to perform the upgrade.
If you don’t follow Raspberry Pi on Instagram, you really should, for there you will find #SnazzyRPi, a collection of snazzy-looking Raspberry Pi photographs taken by our very own Fiacre Muller.
Do you have a Raspberry Pi 3 A+? What have you built with it? . And how snazzy is this photo from @fiacremuller?! . . . . . #RaspberryPi #3A+ #RaspberryPi3A+ #Computing
4,412 Likes, 90 Comments – Raspberry Pi (@raspberrypifoundation) on Instagram: “Do you have a Raspberry Pi 3 A+? What have you built with it? . And how snazzy is this photo from…”
Here are a few more to whet your appetite. Enjoy.
Join the #SnazzyRPi revolution and share your Raspberry Pi glamour shots on Instagram using #SnazzyRPi
The post Snazzy photographs of Raspberry Pis #SnazzyRPi appeared first on Raspberry Pi.
La recherche ESET découvre un exploit jour-zéro qui tire parti d'une vulnérabilité d'escalade des privilèges locaux dans Windows.
The post L’exploit jour zéro CVE 2019 1132 utilisé pour des attaques ciblées appeared first on WeLiveSecurity
NASA scientist Dr Jamie Molaro plans to conduct potentially ground-breaking research using a Raspberry Pi seismometer and a mini rover.
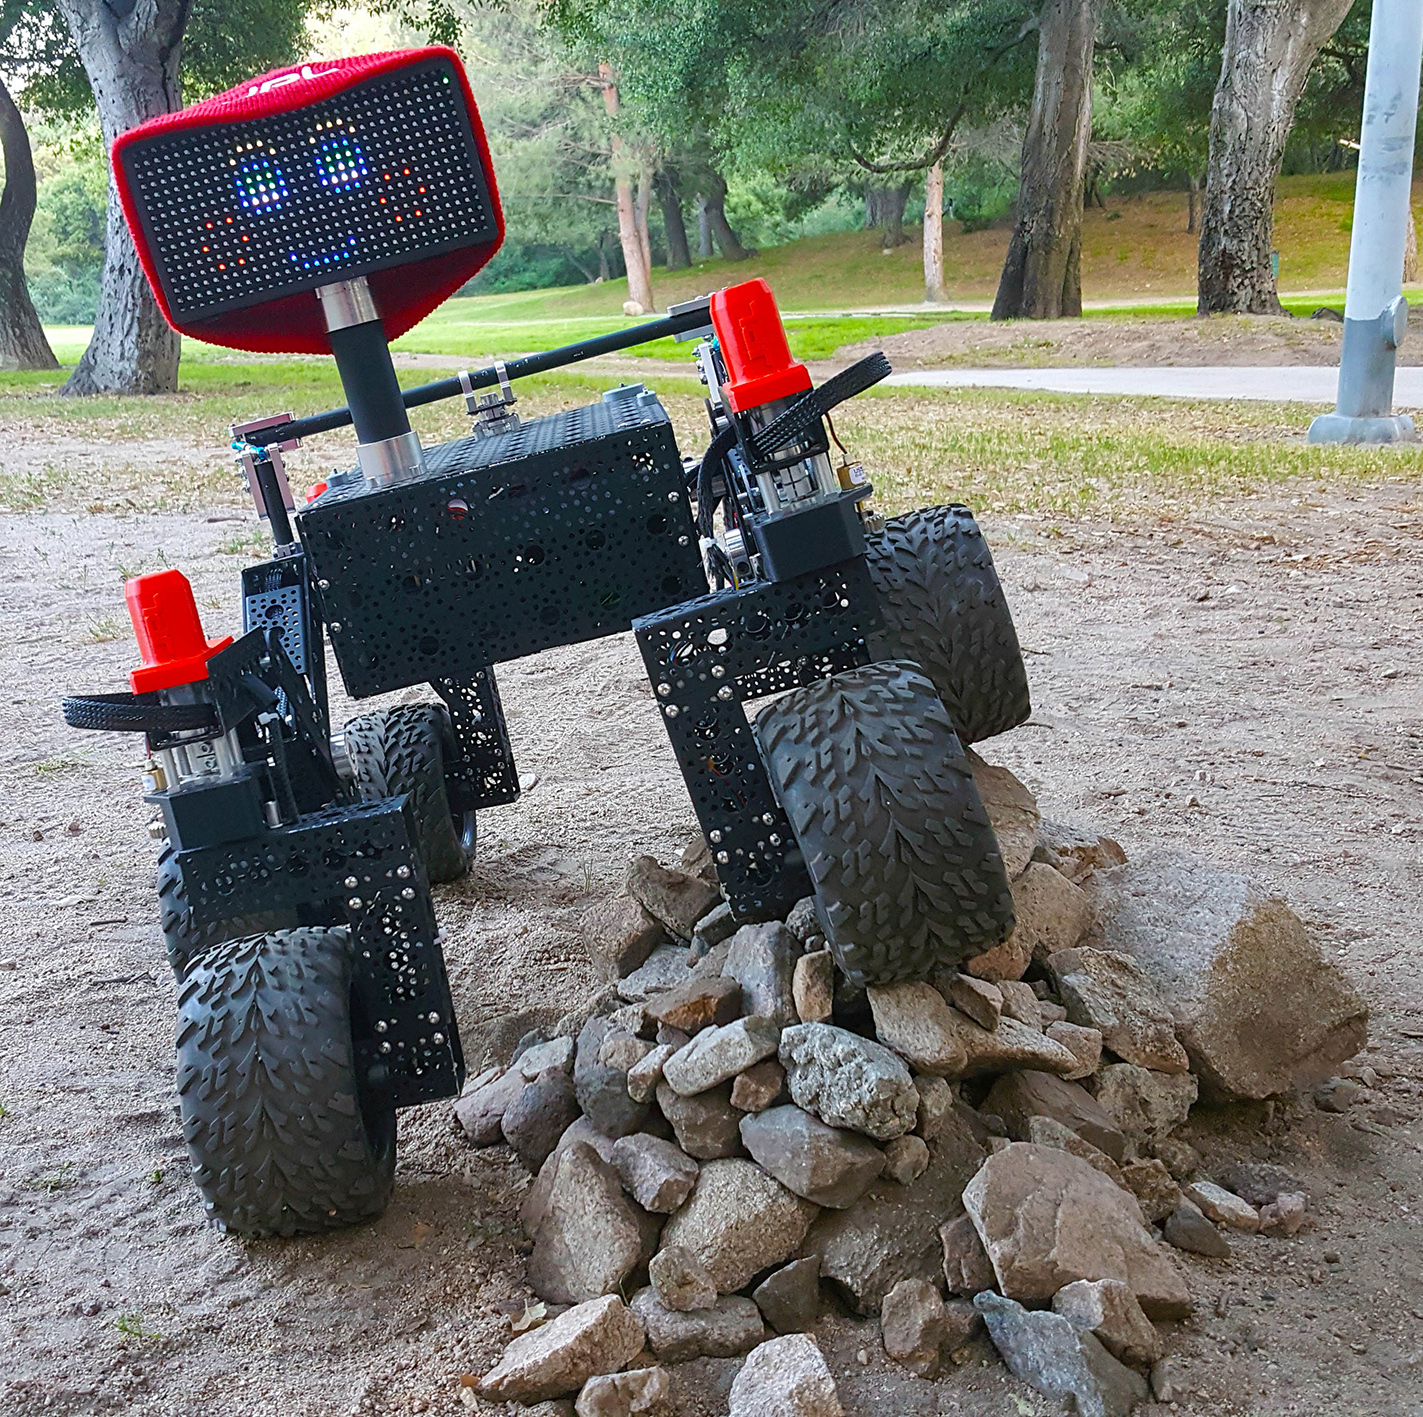
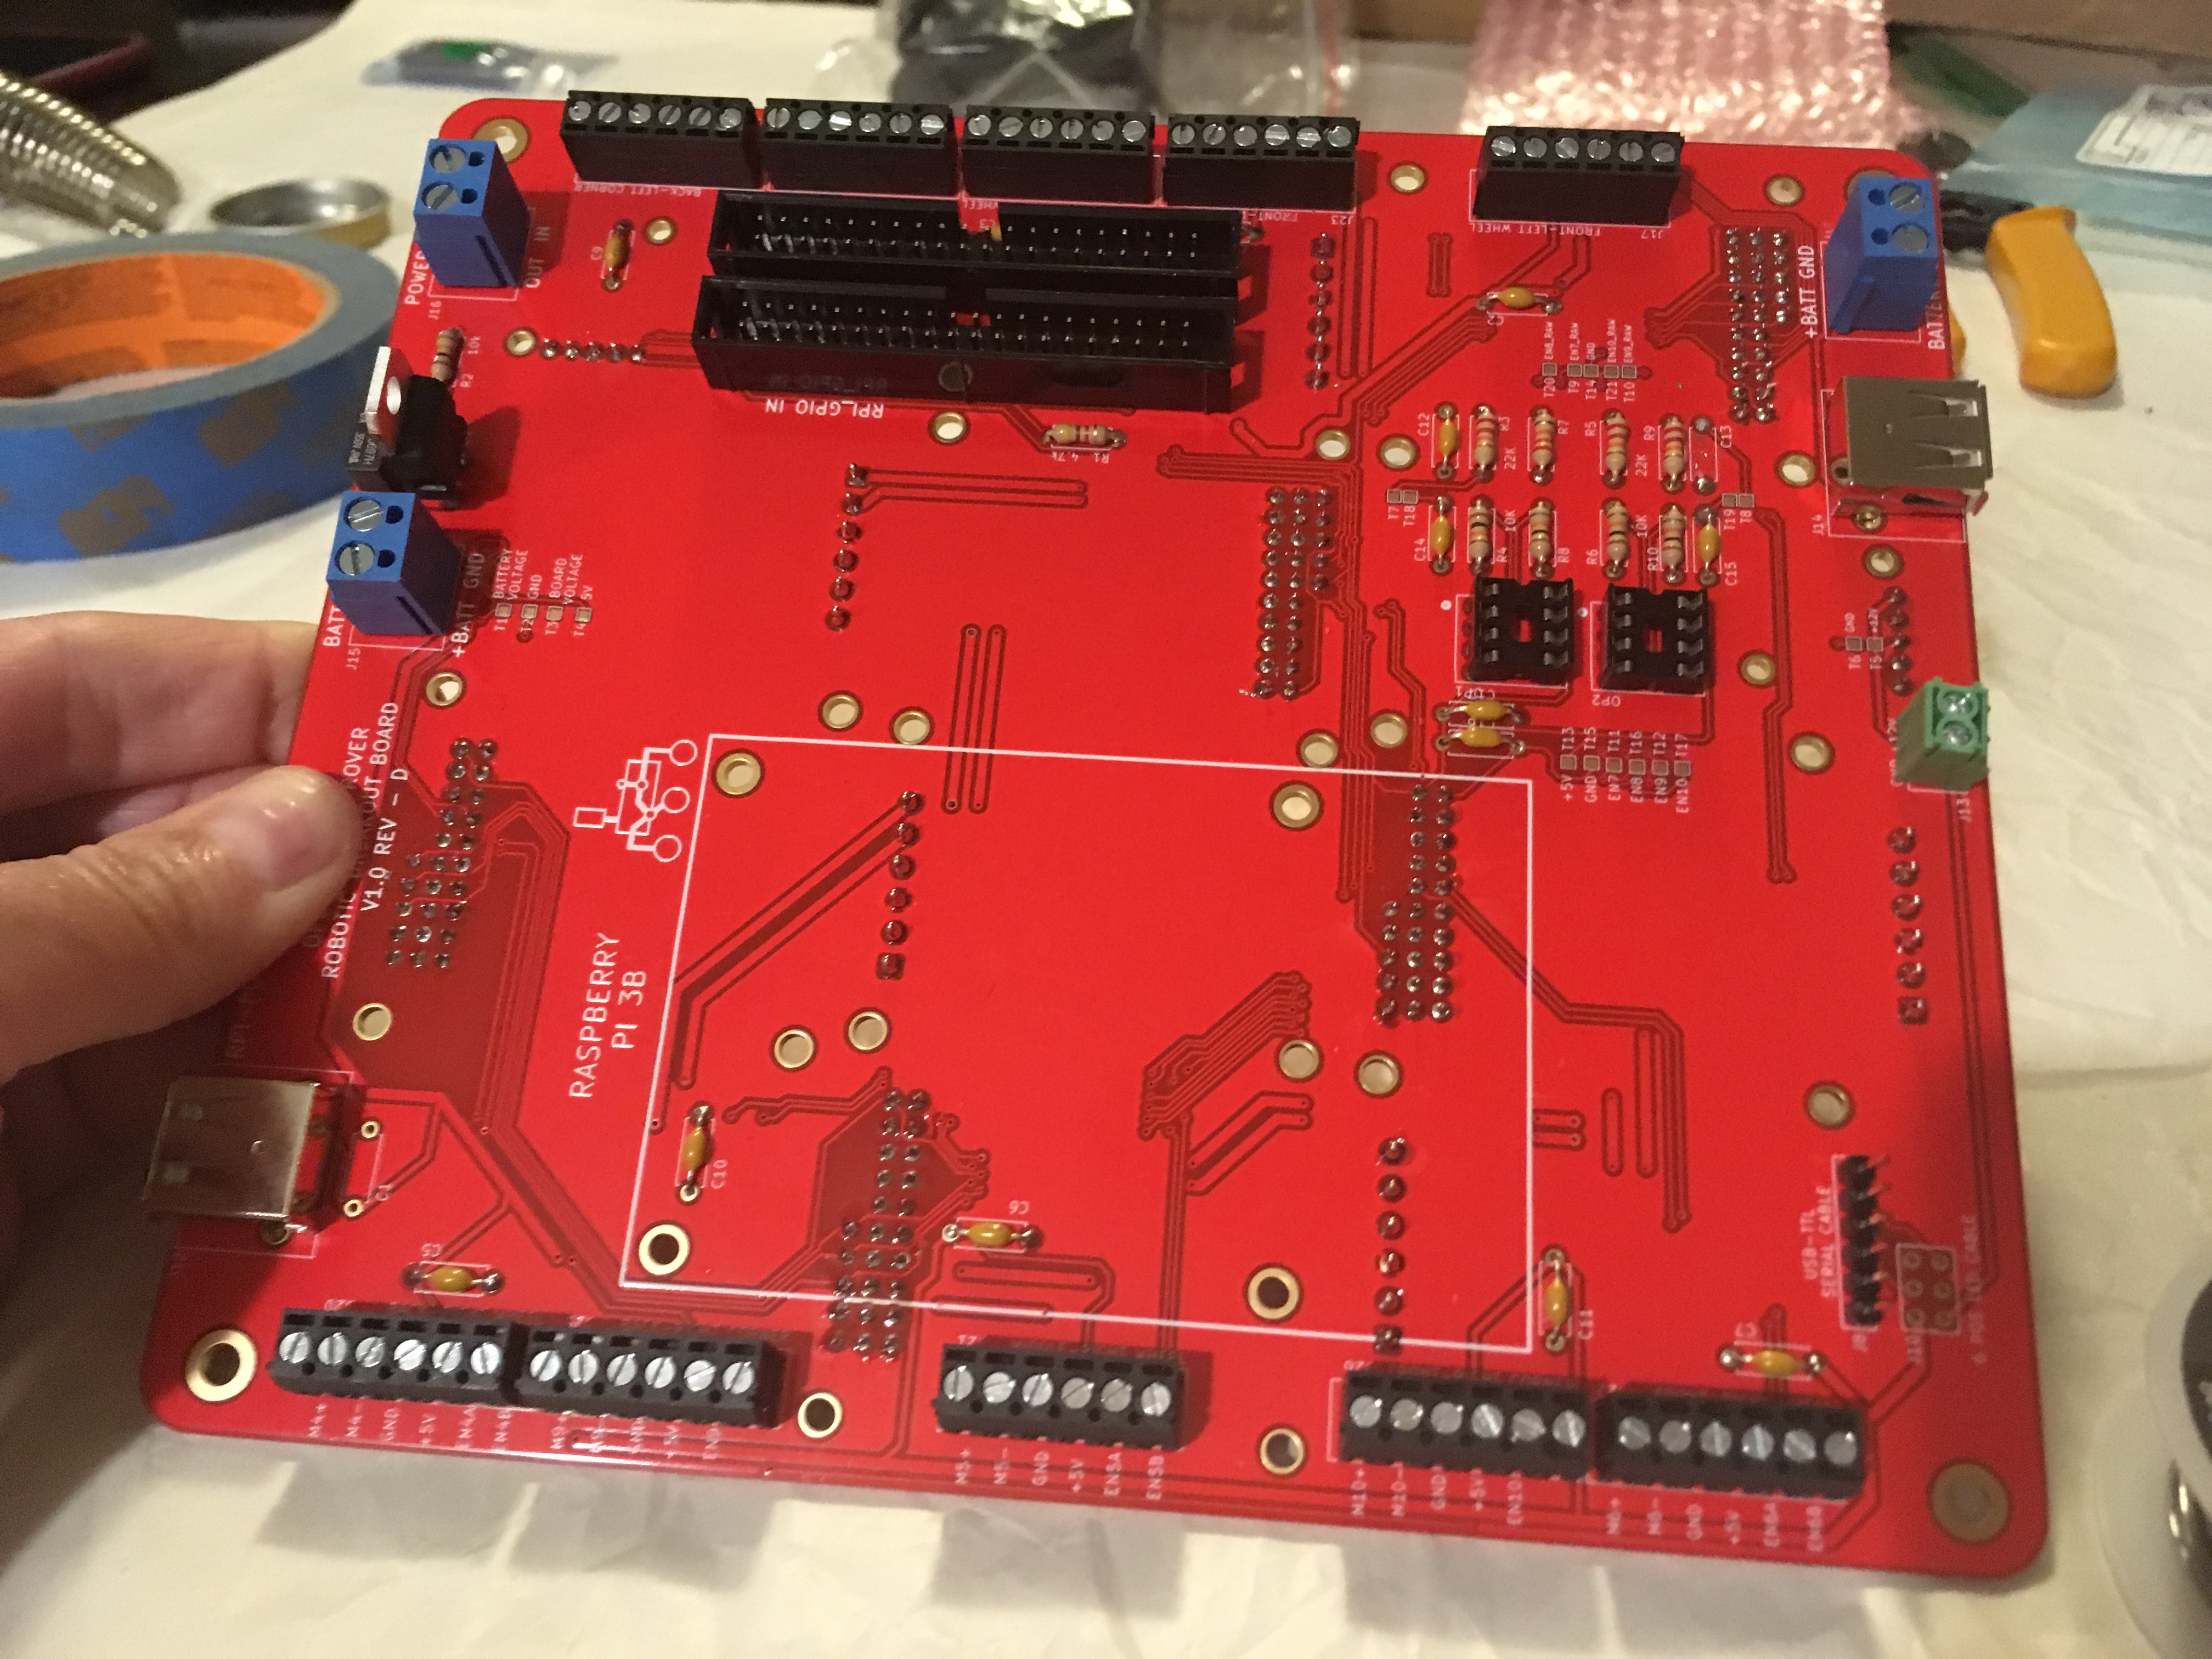
Jamie has been working on a payload-loaded version of NASA’s Open Source Rover
In the summer of 2018, engineers at NASA’s Jet Propulsion Laboratory built a mini planetary rover with the aim of letting students, hobbyists, and enthusiasts create one for themselves. It uses commercial off-the-shelf parts and has a Raspberry Pi as its brain. But despite costing about $5333 in total, the Open Source Rover Project has proven rather popular, including among people who actually work for the USA’s space agency.
One of those is Dr Jamie Molaro, a research scientist at the Planetary Science Institute. Her main focus is studying the surfaces of rocky and icy airless bodies such as comets, asteroids, and the moons orbiting Earth, Jupiter, and Saturn. So when she decided to create her mini-rover – which she dubbed PARSLEE, or Planetary Analog Remote Sensor and ‘Lil Electronic Explorer – she also sought to shake things up a little.
Constructing the robot itself was, she says, rather straightforward: the instructions were detailed and she was able to draw upon the help of others in a forum. Jamie also built the robot with her husband, a software engineer at Adobe. “My interest in the Open Source Rover Project was driven by my scientific background, but not my ability to build it”, she tells us, of what is essentially a miniature version of the Curiosity rover trundling over the surface of Mars.
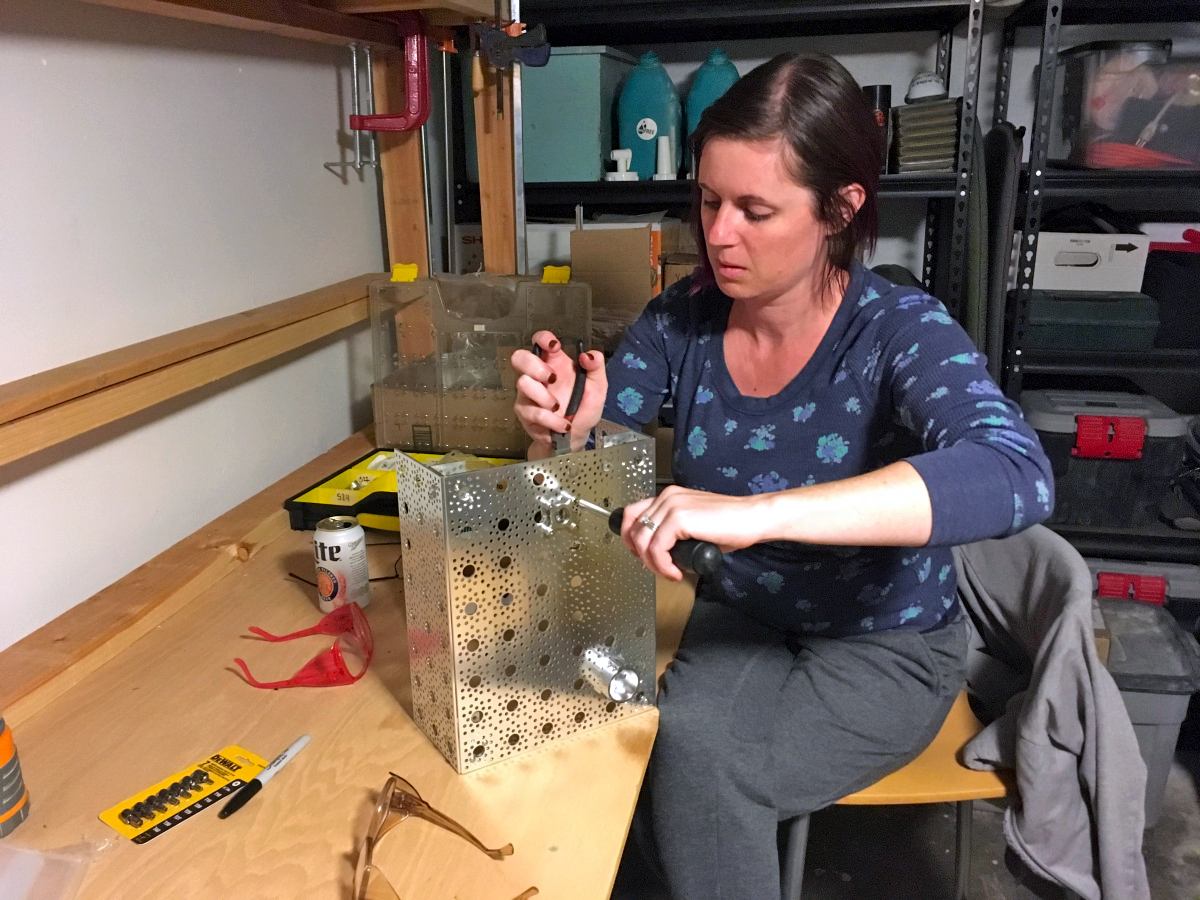
After building the rover wheel assembly, Jamie worked on the head assembly and then the main body itself
Jamie’s interest in science led to her considering the rover’s potential payload before the couple had even finished building it. She added a GoPro camera and a Kestrel 833, which measures temperature, pressure, elevation, wind speed, and humidity. In addition, she opted to use a Raspberry Shake seismometer – a device costing a few hundred dollars which comprises a device sensor, circuit board, and digitiser – with a Raspberry Pi board and a preprogrammed microSD card.
With the electronics assembly complete, Jamie and her husband could get on with integrating PARSLEE’s parts
The sensor records activity, converts the analogue signals to digital, and allows the recorded data to be read on Raspberry Shake servers. Jamie hopes to use PARSLEE to study the kinds of processes active at the surface of other planets. A seismometer helps us understand our physical environment in a very different way than images from a camera, she says.
To that end, with funding, Jamie would like to heat and cool boulders and soils in the lab and in the field and analyse their seismic signature. Thermally driven shallow moonquakes were recorded by instruments used by the Apollo astronauts, she says. “We believe these quakes may reflect signals from a thermal fracturing process that breaks down lunar boulders, or from the boulders and surrounding soil shifting and settling as it changes temperature throughout the day. We can do experiments on Earth that mimic this process and use what we learn to help us understand the lunar seismic data.”
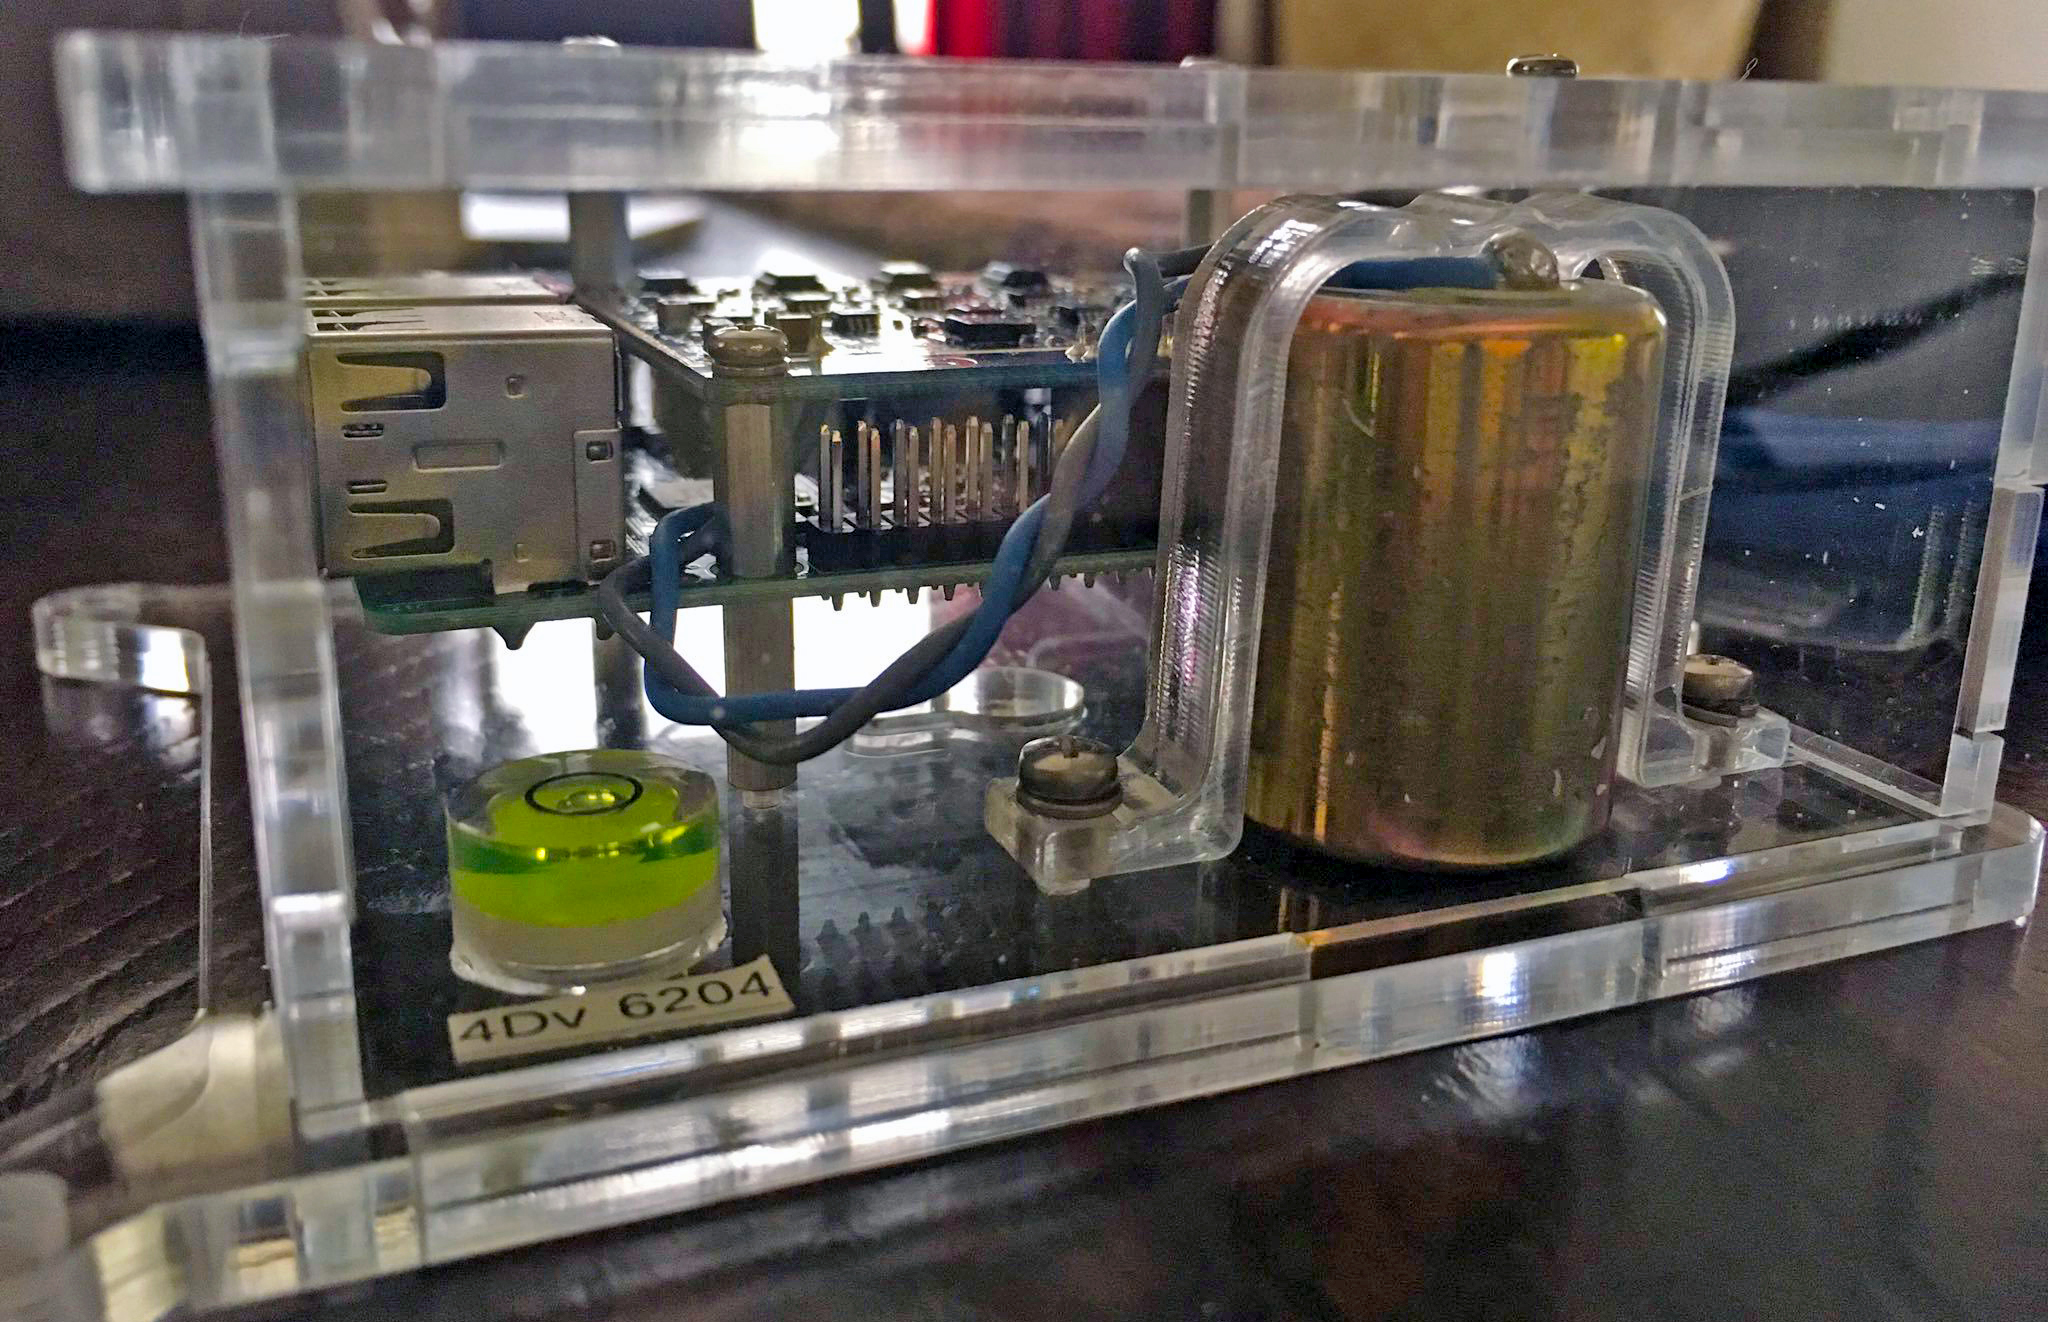
A Raspberry Pi processes the data recorded from the sensor and powers the whole device, with the whole unit forming a payload on PARSLEE
Jamie is also toying with optimum locations for the Shake-fitted rover. The best planetary analogue environments are usually deserts, due to the lack of moisture and low vegetation, she reveals. Places like dry lake beds, lava flows, and sand dunes all provide good challenges in terms of testing the rover’s ability to manoeuvre and collect data, as well as to try out technology being developed with and for it. One thing’s for sure, it is set to travel and potentially make a scientific breakthrough: anyone can use the rover for DIY science experiments.
Read more about PARSLEE on Jamie’s website.
This article is from the brand-new issue of The MagPi, the official Raspberry Pi magazine. Buy it from all good newsagents, subscribe to pay less per issue and support our work, or download the free PDF to give it a try first.
The post NASA, Raspberry Pi and a mini rover appeared first on Raspberry Pi.
Les temps ont changé avec le RGPD, et l'Information Commissioner’s Office britannique peut maintenant imposer des amendes beaucoup plus substantielles.
The post L’organisme de surveillance des données du Royaume‑Uni infligera deux méga‑amendes appeared first on WeLiveSecurity
Les chercheurs d'ESET ont découvert une campagne malveillante distribuant une backdoor via des torrents, utilisant des contenus télévisuels sud-coréens comme appât.
The post Une campagne malveillante vise des utilisateurs sud‑coréens avec des torrents incluant une backdoor appeared first on WeLiveSecurity
In Hello World issue 9, Raspberry Pi’s own Mac Bowley shares a lesson that introduces students to databases using Python and text files.

In this lesson, students create a library app for their books. This will store information about their book collection and allow them to display, manipulate, and search their collection. You will show students how to use text files in their programs that act as a database.
The project will give your students practical examples of database terminology and hands-on experience working with persistent data. It gives opportunities for students to define and gain concrete experience with key database concepts using a language they are familiar with. The script that accompanies this activity can be adapted to suit your students’ experience and competency.
This ready-to-go software project can be used alongside approaches such as PRIMM or pair programming, or as a worked example to engage your students in programming with persistent data.
Start by asking the students why we need databases and what they are: do they ever feel unorganised? Life can get complicated, and there is so much to keep track of, the raw data required can be overwhelming. How can we use computing to solve this problem? If only there was a way of organising and accessing data that would let us get it out of our head. Databases are a way of organising the data we care about, so that we can easily access it and use it to make our lives easier.

Then explain that in this lesson the students will create a database, using Python and a text file. The example I show students is a personal library app that keeps track of which books I own and where I keep them. I have also run this lesson and allowed the students pick their own items to keep track of — it just involves a little more planning time at the end. Split the class up into pairs; have each of them discuss and select five pieces of data about a book (or their own item) they would like to track in a database. They should also consider which type of data each of them is. Give them five minutes to discuss and select some data to track.
Databases are organised collections of data, and this allows them to be displayed, maintained, and searched easily. Our database will have one table — effectively just like a spreadsheet table. The headings on each of the columns are the fields: the individual pieces of data we want to store about the books in our collection. The information about a single book are called its attributes and are stored together in one record, which would be a single row in our database table. To make it easier to search and sort our database, we should also select a primary key: one field that will be unique for each book. Sometimes one of the fields we are already storing works for this purpose; if not, then the database will create an ID number that it uses to uniquely identify each record.
Pull the class back together and ask a few groups about the data they selected to track. Make sure they have chosen appropriate data types. Ask some if they can find any of the fields that would be a primary key; the answer will most likely be no. The ISBN could work, but for our simple application, having to type in a 10- or 13-digit number just to use for an ID would be overkill. In our database, we are going to generate our own IDs.
The requirements for our database are that it can do the following things: save data to a file, read data from that file, create new books, display our full database, allow the user to enter a search term, and display a list of relevant results based on that term. We can decompose the problem into the following steps:
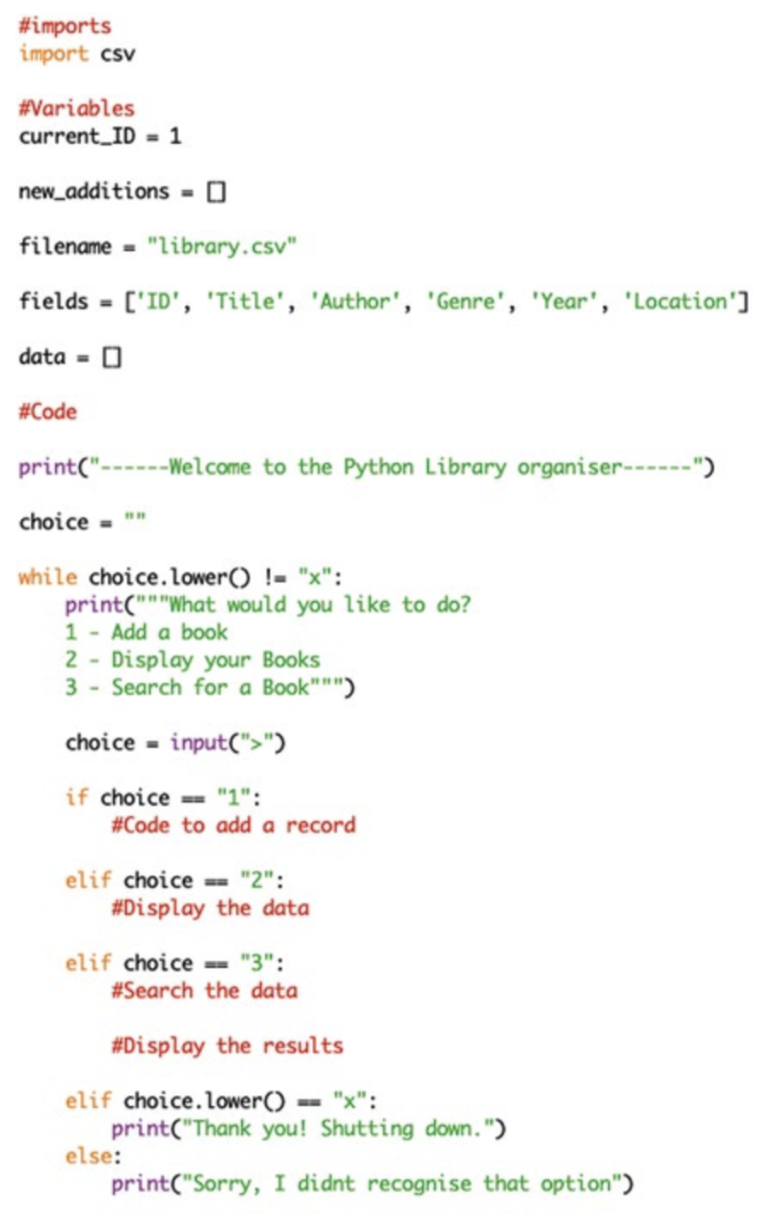
Have the class log in and power up Python. If they are doing this locally, have them create a new folder to hold this project. We will be interacting with external files and so having them in the same folder avoids confusion with file locations and paths. They should then load up a new Python file. To start, download the starter file from the link provided. Each student should make a copy of this file. At first, I have them examine the code, and then get them to run it. Using concepts from PRIMM, I get them to print certain messages when a menu option is selected. This can be a great exemplar for making a menu in any application they are developing. This will be the skeleton of our database app: giving them a starter file can help ease some cognitive load from students.
Have them examine the variables and make guesses about what they are used for.
current_ID – a variable to count up as we create records, this will be our primary keynew_additions – a list to hold any new records we make while our code is running, before we save them to the filefilename – the name of the database file we will be usingfields – a list of our fields, so that our dictionaries can be aligned with our text filedata – a list that will hold all of the data from the database, so that we can search and display it without having to read the file every timeWe are going to use dictionaries to store our records. They reference their elements using keys instead of indices, which fit our database fields nicely. We are going to generate our own IDs. Each of these must be unique, so a variable is needed that we can add to as we make our records. This is a user-focused application, so let’s make it so our user can input the data for the first book. The strings, in quotes, on the left of the colon, are the keys (the names of our fields) and the data on the right is the stored value, in our case whatever the user inputs in response to our appropriate prompts. We finish this part of by adding the record to the file, incrementing the current ID, and then displaying a useful feedback message to the user to say their record has been created successfully. Your students should now save their code and run it to make sure there aren’t any syntax errors.
You could make use of pair programming, with carefully selected pairs taking it in turns in the driver and navigator roles. You could also offer differing levels of scaffolding: providing some of the code and asking them to modify it based on given requirements.
To complete the project, your students can add functionality to save their data to a CSV file, read from a database file, and allow users to search the database. The code for the whole project is available at helloworld.cc/database.
An example of the code
You may want to give your students the entire piece of code. They can investigate and modify it to their own purpose. You can also lead them through it, having them follow you as you demonstrate how an expert constructs a piece of software. I have done both to great effect. Let me know how your classes get on! Get in touch at contact@helloworld.cc
The brand-new issue of Hello World is out today, and available right now as a free PDF download from the Hello World website.
UK-based educators can also sign up to receive Hello World as printed magazine FOR FREE, direct to their door. And those outside the UK, educator or not, can subscribe to receive new digital issues of Hello World in their inbox on the day of release.
The post How to build databases using Python and text files | Hello World #9 appeared first on Raspberry Pi.
If you’ve visited the Wizarding World of Harry Potter and found yourself in possession of an interactive magic wand as a souvenir, then you’ll no doubt be wondering by now, “What do I do with it at home though?”
While the wand was great for setting off window displays at the park itself, it now sits dusty and forgotten upon a shelf. But it still has life left in it — let Jasmeet Singh show you how.
Real Working Harry Potter Wand With Computer Vision and ML
A few months back my brother visited Japan and had real wizarding experience in the Wizarding World of Harry Potter at the Universal Studios made possible through the technology of Computer Vision. At the Wizarding World of Harry Potter in Universal Studios the tourists can perform “real magic” at certain locations(where the motion capture system is installed) using specially made wands with retro-reflective beads at the tip.
The interactive displays at Universal Studios’ Wizarding World of Harry Potter have infrared cameras in place, which are ready to read the correct movements of retroflector-tipped wands. Move your wand in the right way, and the cameras will recognise your spell and set window displays in motion. Oooooo…magic!

How do I know this? Thanks to William Osman and Allen Pan, who used this Wizarding World technology to turn cheap hot dogs into their own unique wands! Those boys…
Hacking Wands at Harry Potter World
How to make your very own mostly-functional interactive wand. Please don’t ban me from Universal Studios. Links on my blog: http://www.williamosman.com/2017/12/hacking-harry-potter-wands.html Allen’s Channel: https://www.youtube.com/channel/UCVS89U86PwqzNkK2qYNbk5A Support us on Patreon: https://www.patreon.com/williamosman Website: http://www.williamosman.com/ Facebook: https://www.facebook.com/williamosmanscience/ InstaHam: https://www.instagram.com/crabsandscience/ CameraManJohn: http://www.johnwillner.com/
For his Raspberry Pi-enabled wand project, Jasmeet took that same Wizarding World concept to create a desktop storage box that opens and closes in response to the correct flicks of a wand.
A simple night vision camera can be used as our camera for motion capture as they also blast out infrared light which is not visible to humans but can be clearly seen with a camera that has no infrared filter.
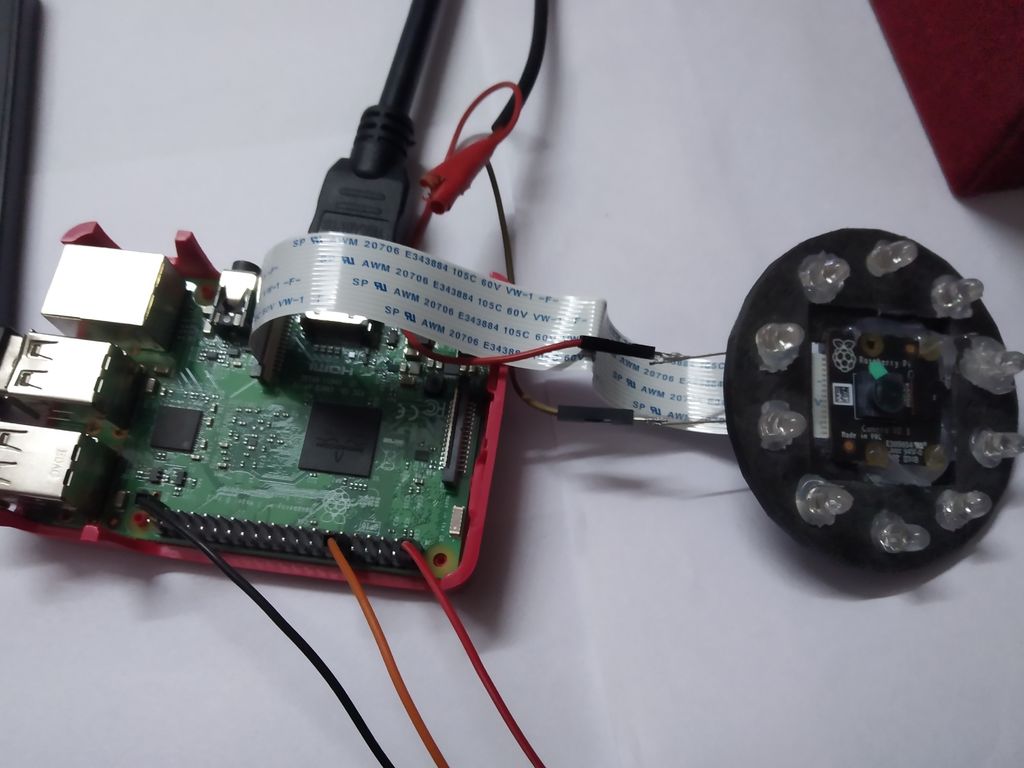
So, the video stream from the camera is fed into a Raspberry Pi which has a Python program running OpenCV which is used for detecting, isolating and tracking the wand tip. Then we use SVM (Simple Vector Machine) algorithm of machine learning to recognize the pattern drawn and accordingly control the GPIOs of the raspberry pi to perform some activities.
For more information on the project, including all the code needed to get started, head over to hackster.io to find Jasmeet’s full tutorial.
The post Take the Wizarding World of Harry Potter home with you appeared first on Raspberry Pi.
Nous partageons trois options de réseau différentes pour naviguer anonymement sur Internet et ainsi, protéger votre vie privée sur le Web
The post Trois moyens de surfer anonymement sur Internet appeared first on WeLiveSecurity
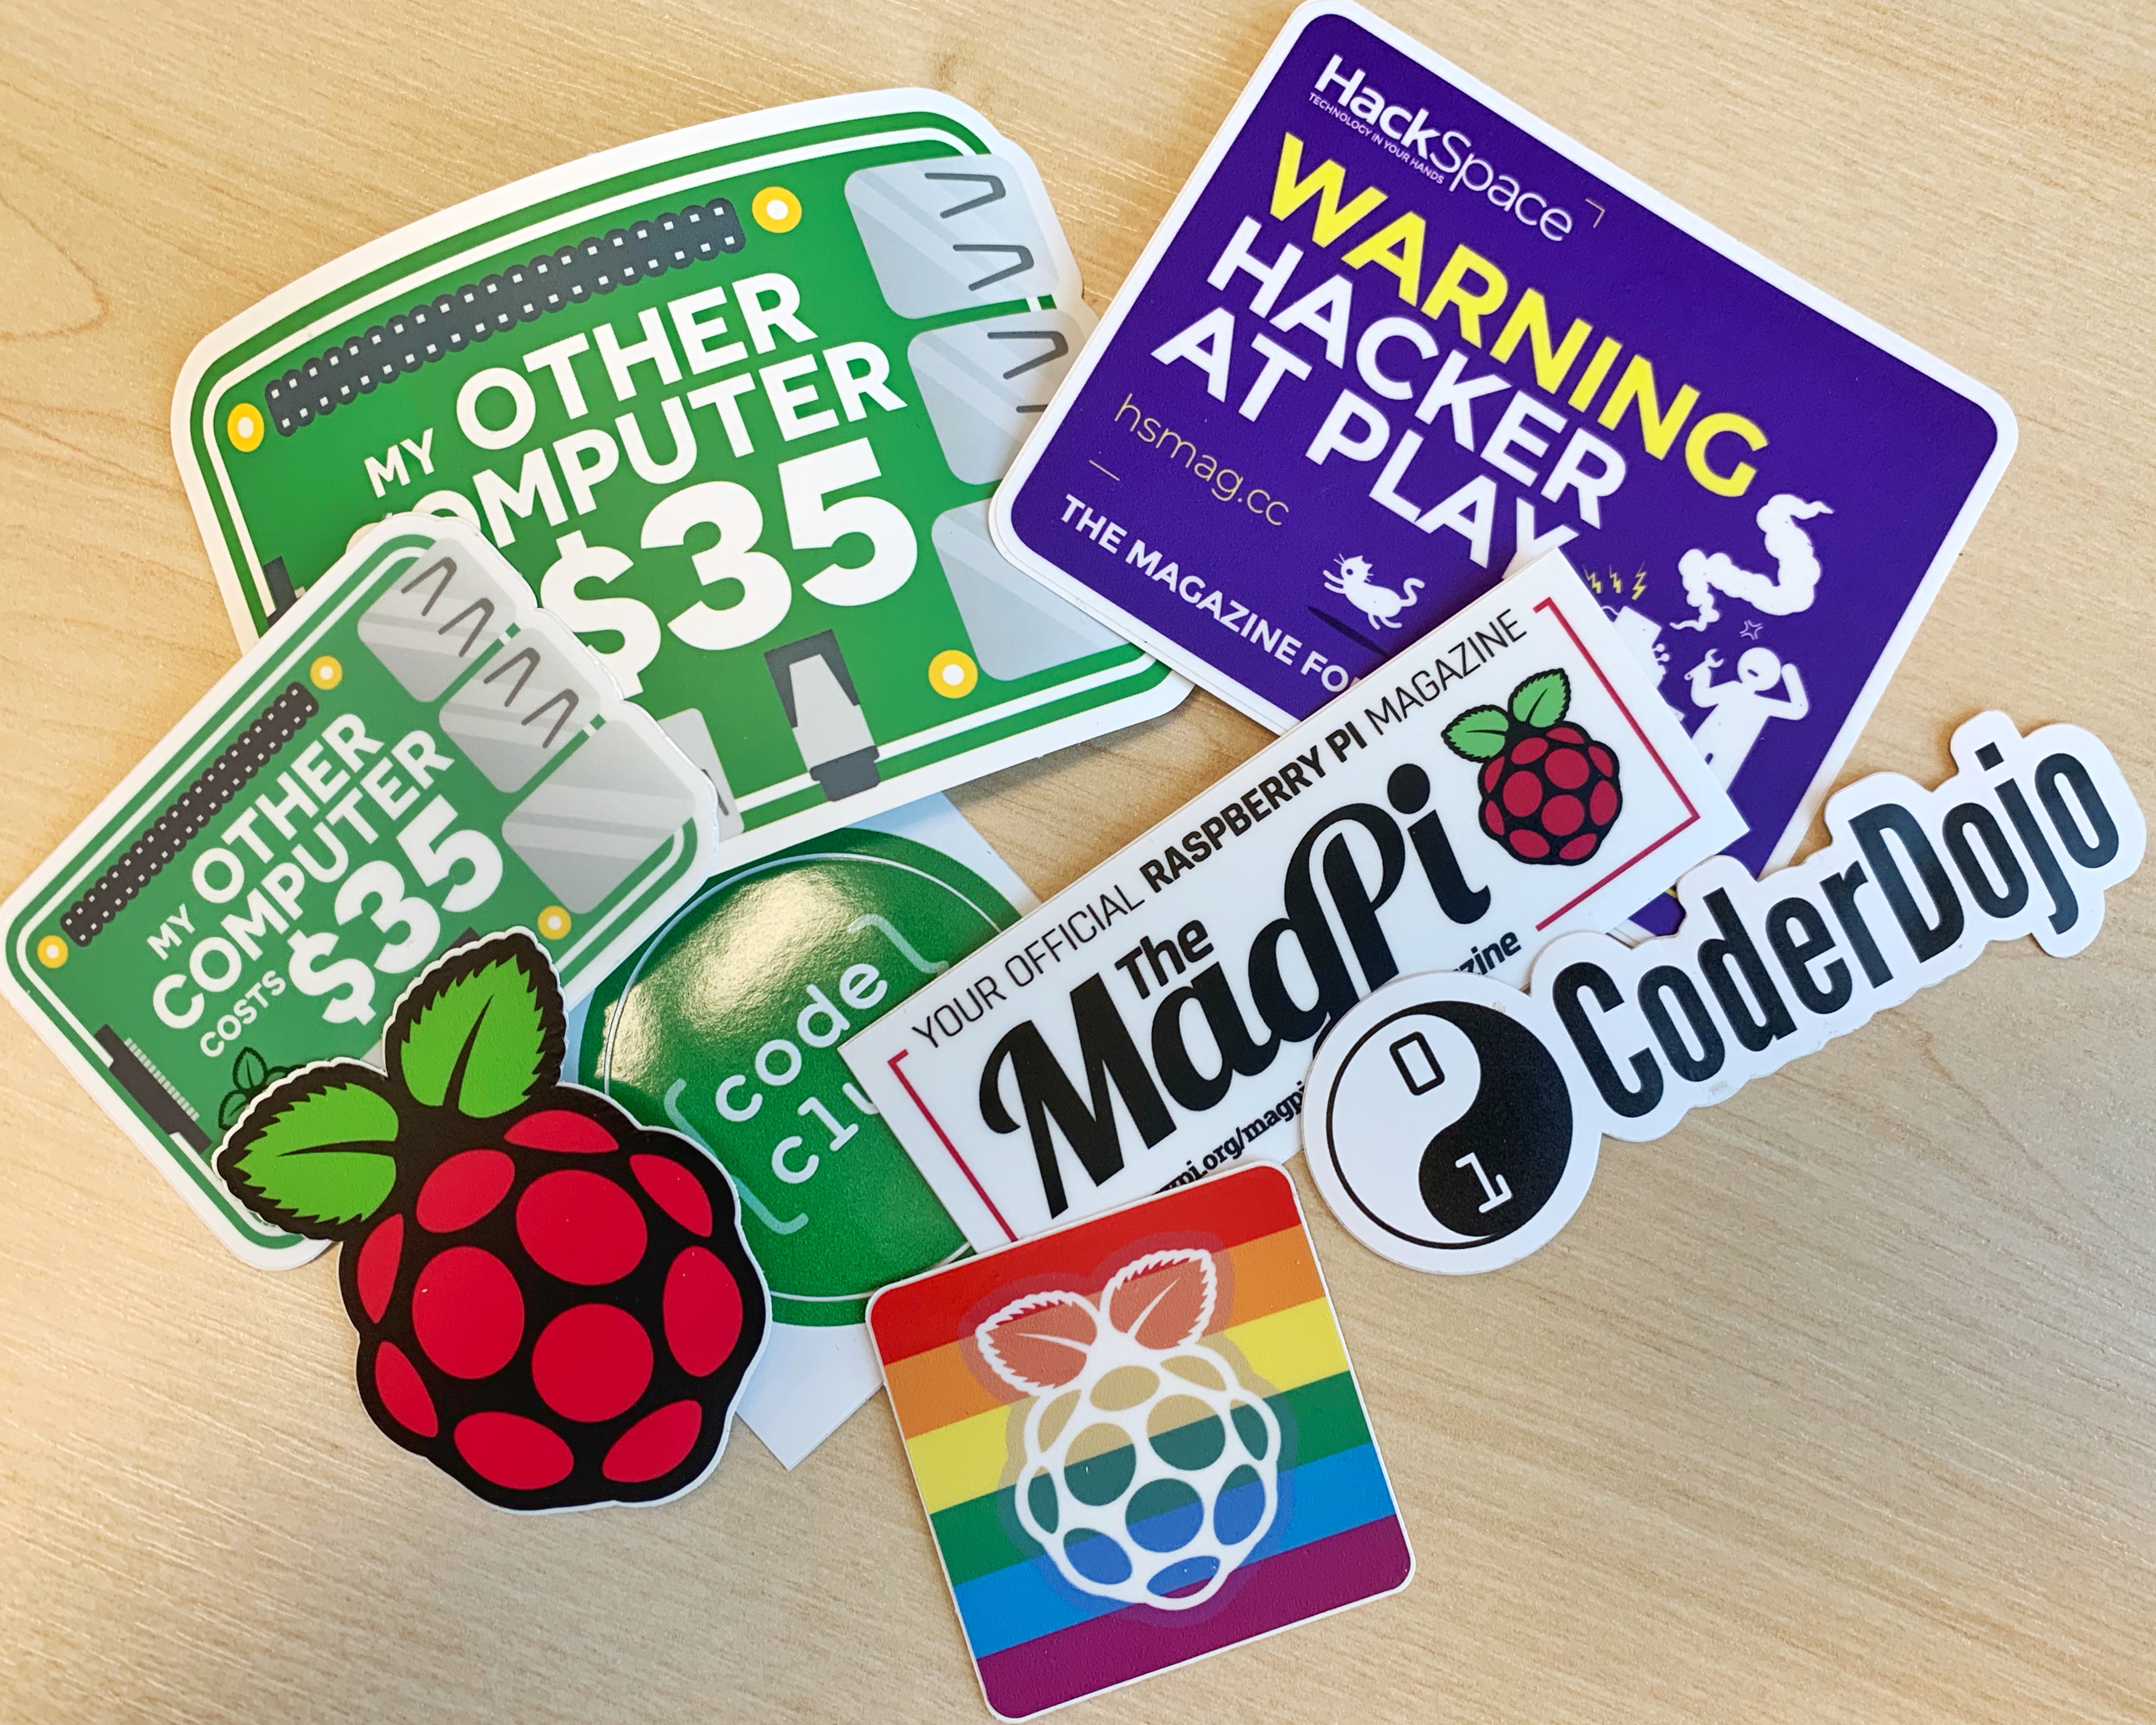
To celebrate the launch of Raspberry Pi 4, and because it’s almost the weekend, we’re giving away some sticker packs!
For your chance to win a pack, all you have to do is leave a comment below, or comment on the Facebook post about this give-away, or tweet us with the hashtag #GimmeRaspberryPiStickers — all before midnight (BST) Monday 8 July.
Each sticker pack will contain the following stickers, plus any others I find between now and Monday, and we have 10 packs to give away.
Winners will be picked at random, and I’ll tweet who these lucky ten are on Tuesday, so keep your eyes peeled.
Good luck!
Oh, if you don’t see your comment on this post, it’s because you’re new to the blog and we haven’t approved it yet. Don’t worry, it’s there, and we’ll see it before the contest ends.
The post Win some Raspberry Pi stickers #GimmeRaspberryPiStickers appeared first on Raspberry Pi.
How do I check CPU temperature in OpenSUSE Linux using a command line and GUI tools on my Thinkpad laptop?
The post How to check CPU temperature in OpenSUSE Linux appeared first on nixCraft.
« Ce n’est pas bon », a écrit l'ancien DSI d'Equifax dans un message texte, après avoir pris connaissance de la brèche qui a fini par toucher près de la moitié de la population des États-Unis.
The post Un ancien dirigeant d’Equifax envoyé en prison pour délit d’initié lié à la brèche de sécurité appeared first on WeLiveSecurity