 Connexion


The composition of the world’s largest companies has shifted considerably since 2020, as energy giants have given way to a growing mix of retail, technology, and healthcare firms.
This visualization ranks the world’s 10 largest companies by annual revenue between 2020 and 2026, using the latest available data from the Fortune Global 500. Revenue figures are for fiscal years ending on or before March of a given year.
In 2020, five of the world’s 10 largest companies by annual revenue were energy companies, led by Chinese oil refiner Sinopec ($407 billion).
Walmart ($524 billion) was the only company to generate more revenue than Sinopec that year. The table below ranks the world’s top-revenue companies in 2020.
| Rank | Company | 2020 Revenue (billions $) |
|---|---|---|
| 1 | Walmart | 524 |
| 2 | Sinopec | 407 |
| 3 | State Grid | 384 |
| 4 | PetroChina | 379 |
| 5 | Shell | 352 |
| 6 | Saudi Aramco | 330 |
| 7 | Volkswagen | 283 |
| 8 | BP | 283 |
| 9 | Amazon | 281 |
| 10 | Toyota | 275 |
Chinese state-owned companies occupied three of the top four spots, while Saudi Aramco ($330 billion) and BP ($283 billion) also made the top 10.
However, the effects of the pandemic led to a decline in energy demand. As a result, all non-Chinese energy companies fell off the world’s top 10 list in 2021.
By 2026, no privately owned energy companies remained among the world’s 10 largest firms by revenue. Retail led the ranking, with Amazon ($717 billion) narrowly surpassing Walmart ($713 billion).
Amazon’s ascent to become the world’s top-revenue firm has been dramatic. In 2020, the company ranked ninth worldwide with $281 billion in revenue.
Sales surged in 2020 and 2021 as consumers stayed home and ordered more online. Amazon climbed to third place in 2021 and ranked second in 2022, 2024, and 2025. In 2026, it edged out Walmart by just $4 billion for the top spot.
| Rank | Company | 2026 Revenue (billions $) |
|---|---|---|
| 1 | Amazon | 717 |
| 2 | Walmart | 713 |
| 3 | State Grid | 555 |
| 4 | UnitedHealth Group | 448 |
| 5 | Saudi Aramco | 446 |
| 6 | Apple | 416 |
| 7 | McKesson | 403 |
| 8 | Alphabet | 403 |
| 9 | CVS Health | 402 |
| 10 | PetroChina | 402 |
Healthcare companies also gained significant ground over the period.
Healthcare has become one of the largest economic sectors in major markets such as the U.S. and Europe, partly due to aging populations.
Neither UnitedHealth Group nor CVS Health ranked among the world’s top 10 companies by revenue in 2020. By 2026, UnitedHealth had climbed to fourth place with $448 billion in revenue, while CVS Health ranked ninth at $402 billion.
The post Ranked: The World’s Largest Companies by Revenue (2020-2026) appeared first on Activist Post.
For more than four centuries, the Mercator projection has shaped one of the world’s most familiar views of the planet.
The icon map was designed to make navigation on the Earth’s oceans easier, but it came with a cost: the farther a place lies from the equator, the more dramatically its size is exaggerated.
On Sept. 4, 2026, the United Nations General Assembly endorsed the Equal Earth projection, an equal-area world map published in 2018, and encouraged governments, schools, media, and technology platforms to use it wherever the comparative size of continents matters.
The graphic above shows that map, using the free Equal Earth wall map published by cartographer Tom Patterson, one of the projection’s three creators, with vote details from UN resolution A/80/L.104 and the UN’s meetings coverage.
Every flat map has to give something up, and the two below make different trade-offs.
Mercator, on top, keeps compass bearings straight and pays for it in area, stretching land more as it approaches the poles. Equal Earth, beneath it, keeps area exact and lets shapes bend slightly instead. Africa, Canada, and Greenland are highlighted on both so you can see what happens to each when the projection changes.
Gerardus Mercator designed his map in 1569 for sailors. A straight line on it follows a constant compass bearing, which made it indispensable at sea and, much later, useful for seamless online maps.
The trade-off is that it stretches the world more and more as you move away from the equator. At 60° north, roughly the latitude of Oslo or Anchorage, land is drawn four times too large. At 80° north, it is drawn 33 times too large.
Equal Earth was created in 2018 by Bojan Šavrič of Esri, Tom Patterson of the U.S. National Park Service, and Bernhard Jenny of Monash University, and published in the International Journal of Geographical Information Science.
Equal Earth keeps sizes exact while borrowing the rounded outline of the popular Robinson projection, which is why it looks familiar even though the proportions are different.
The clearest way to see the difference is to lift three landmasses off the map and place them next to one another at the same scale.
The biggest surprise is not how much Africa grows, but how much Canada and Greenland shrink. Because Africa straddles the equator, Mercator already shows it close to its true scale, while northern landmasses are dramatically enlarged.
Mercator does not shrink Africa. The continent is drawn at roughly 1.1 times its true size, close to exact. Instead, Mercator inflates land farther north, making Africa look smaller by comparison.
Drawn at the same scale, Africa covers about 30.4 million square kilometers, Canada just under 10 million, and Greenland 2.17 million. On Equal Earth, all three appear at their real proportions: Africa is 14 times the size of Greenland and three times the size of Canada.
On Mercator, Canada appears about 50% larger than Africa even though it is only one-third the size, while Greenland appears nearly as large as the continent.
There is one wrinkle in the UN’s push to replace Mercator: Mercator is not the projection used on the UN’s own world map.
Its official Map of the World, shown first below, uses the Robinson projection, a rounded compromise designed to look visually balanced rather than preserve exact area. Beneath it is the Equal Earth map the General Assembly just endorsed, drawn at the same width so the two can be compared directly.
The UN’s own guidance says most of its world maps use Robinson, Winkel Tripel, or Eckert IV projections.
Robinson is far gentler than Mercator, but it is not equal-area. By our calculation, the UN’s map draws Greenland at about 1.5 times its true size and Canada and Russia at about 1.2 times, while Africa comes in at 0.85 times.
Relative to Africa, Canada and Russia look roughly 40% larger than they should, while Greenland looks more than 80% larger.
The “Correct the Map” resolution, introduced by Togo for the African Group, passed 164-1 with six abstentions. The United States cast the only “no” vote, calling it a “radical ideological project,” while Estonia, Georgia, Lithuania, Moldova, Serbia, and Ukraine abstained.
The text is non-binding. It does not ban Mercator or affect navigation charts, but it declares Equal Earth the more accurate representation of continental sizes and urges governments, schools, international organizations, and “global technology platforms” to adopt it.
Web maps are unlikely to change soon, since Google Maps, Apple Maps, and most online maps are built on Web Mercator because it tiles neatly at every zoom level. The vote will likely matter most in classrooms, textbooks, and newsrooms, which is exactly where the “Correct the Map” campaign, backed by the African Union, wants to see change.
The African Union has already adopted Equal Earth, France has said it will drop Mercator from official communications, and Togo plans to update its textbooks and convene UNESCO, the AU, and technology companies in early 2027.
The post The New World Map the UN Wants You to Use appeared first on Activist Post.

This was originally posted on our Voronoi app. Download the app for free on iOS or Android and discover incredible data-driven charts from a variety of trusted sources.
As artificial intelligence transforms the workplace, one question is becoming increasingly important: which jobs are the hardest to automate?
Occupations that depend on human interaction, physical adaptability, and real-world judgment tend to be more resilient than those centered on routine information processing.
This visualization, created by Julie R. Peasley, ranks 20 of America’s largest in-demand occupations by their AI resilience using data from JobZone Risk alongside employment outlook information from the U.S. Bureau of Labor Statistics.
The ranking combines labor demand with AI resilience to highlight occupations that may be better positioned as AI capabilities continue to improve.
Explore the complete ranking below.
| Rank | In-Demand Jobs | AI Risk Score |
|---|---|---|
| 1 | Registered Nurse | 82.2 |
| 2 | Home Health Aide | 72.7 |
| 3 | Elementary School Teacher | 70.0 |
| 4 | Nursing Assistant/CNA | 67.4 |
| 5 | Senior Software Engineer | 55.4 |
| 6 | General Maintenance and Repair Worker | 53.9 |
| 7 | Construction Laborer | 53.2 |
| 8 | Maid/Housekeeping | 51.3 |
| 9 | Teaching Assistant | 51.2 |
| 10 | Accountant | 47.3 |
| 11 | Waiter/Waitress | 46.3 |
| 12 | Restaurant Line Cook | 45.2 |
| 13 | Janitor/Cleaner | 44.2 |
| 14 | Security Guard | 43.6 |
| 15 | General and Operations Manager | 37.5 |
| 16 | Long-Haul Truck Driver | 36.0 |
| 17 | Supervisor of Retail Sales Workers | 34.7 |
| 18 | Other Manager | 30.2 |
| 19 | Laborer and Freight, Stock, and Material Mover | 29.9 |
| 20 | Wholesale and Manufacturing Sales Representative | 26.1 |
The results show a clear divide. Healthcare occupations dominate the top of the ranking, while several management, transportation, logistics, and sales roles score much lower.
Registered nurses earn the highest AI resilience score at 82.2, followed by home health aides at 72.7 and nursing assistants/CNAs at 67.4. These occupations depend on hands-on patient care, emotional intelligence, clinical judgment, and adaptability, all of which remain difficult for AI systems to replicate consistently.
The BLS projects continued strong demand for many healthcare occupations as the U.S. population ages and healthcare needs grow. At the same time, AI is increasingly being used to support clinicians by automating administrative tasks rather than replacing patient-facing care.
Education also performs well, with elementary school teachers scoring 70.0 and teaching assistants scoring 51.2. Effective teaching extends far beyond delivering information and includes classroom management, mentoring, creativity, and responding to students’ individual needs.
Skilled trades also remain relatively resilient because physical work in unpredictable environments is difficult to automate. General maintenance and repair workers score 53.9, while construction laborers follow closely at 53.2.
Research on AI resilience increasingly emphasizes diversity of skills and adaptability as important characteristics for organizations and workers navigating rapid technological change.
Some occupations that employ millions of Americans receive much lower resilience scores. General and operations managers score 37.5, long-haul truck drivers score 36.0, laborers and freight movers score 29.9, and wholesale and manufacturing sales representatives rank last at 26.1.
Many of these jobs include information-processing tasks that generative AI can increasingly support. However, few occupations are expected to disappear entirely. AI is more likely to automate specific tasks and reshape how people work.
For workers, resilience increasingly comes from combining technical expertise with human skills that remain difficult to automate, including empathy, leadership, creativity, and problem-solving.
The post Ranked: America’s Most AI-Resistant Jobs appeared first on Activist Post.

Each year, the Economist Intelligence Unit (EIU) evaluates living conditions across major cities worldwide using its Global Liveability Index.
This regional comparison aggregates those city scores to show how livability varies across seven major regions in 2026.
The data for this visualization comes from the Economist Intelligence Unit’s Global Liveability Index. The index measures stability, healthcare, culture and environment, education, and infrastructure, then aggregates the results into regional averages on a scale of 0 to 100.
Western Europe ranked as the world’s most livable region in 2026 with an overall score of 92, closely followed by North America at 90.
| Region | Liveability | Stability | Healthcare | Culture & environment | Education | Infrastructure |
|---|---|---|---|---|---|---|
| Asia | 74 | 76 | 76 | 67 | 82 | 74 |
| North America | 90 | 85 | 92 | 90 | 100 | 92 |
| Western Europe | 92 | 86 | 95 | 92 | 96 | 93 |
| Eastern Europe | 71 | 70 | 71 | 70 | 81 | 70 |
| Latin America | 67 | 58 | 68 | 75 | 80 | 63 |
| Middle East & N. Africa | 61 | 55 | 68 | 52 | 78 | 64 |
| Sub-Saharan Africa | 55 | 49 | 47 | 65 | 65 | 51 |
Both regions performed particularly well in healthcare, education, and infrastructure. North America received a perfect score of 100 in education, while Western Europe recorded the highest healthcare and infrastructure scores.
Stable institutions, mature public services, and extensive transportation networks continue to support high living standards across many cities in both regions.
Asia posted the largest year-over-year improvement among all regions, reaching an average livability score of 74.
According to the EIU, stronger performances by cities in China and Japan helped drive the gains.
Despite this progress, Asia continues to trail Western Europe and North America. Its lowest category score was in culture and environment, while infrastructure performance varied across its rapidly developing economies.
The Middle East and North Africa experienced the largest regional decline in 2026, with its average score falling by one point following the Iran war.
Stability remained the region’s weakest category, contributing to an overall score of 61.
Sub-Saharan Africa ranked last with a score of 55. Healthcare, infrastructure, and stability were its lowest-scoring categories.
Latin America and Eastern Europe occupied the middle of the rankings. Both posted relatively strong education scores, but weaker stability results held down their overall averages.
The post Ranked: The World’s Most Livable Regions in 2026 appeared first on Activist Post.

See visuals like this from many other data creators on our Voronoi app. Download it for free on iOS or Android and discover incredible data-driven charts from a variety of trusted sources.
The countries with the largest government debt totals are not necessarily those carrying the heaviest debt burdens. The picture changes considerably depending on whether debt is measured in dollar terms or relative to the size of a country’s economy.
This graphic uses 2026 projections from the International Monetary Fund (IMF) to compare the world’s 30 most indebted governments using both measures.
At $40.7 trillion, the U.S. is projected to hold by far the world’s largest stock of government debt in 2026. That figure exceeds the combined debt of China, Japan, the United Kingdom, and France, highlighting the extraordinary scale of U.S. borrowing.
The table below ranks the 30 countries with the highest government debt by total value in 2026.
| Rank | Country | Value of debt (billions $) |
|---|---|---|
| 1 | United States | 40,739 |
| 2 | China | 22,290 |
| 3 | Japan | 8,951 |
| 4 | United Kingdom | 4,418 |
| 5 | France | 4,258 |
| 6 | Italy | 3,790 |
| 7 | Germany | 3,523 |
| 8 | India | 3,464 |
| 9 | Canada | 2,776 |
| 10 | Brazil | 2,544 |
| 11 | Spain | 2,054 |
| 12 | Mexico | 1,330 |
| 13 | Singapore | 1,134 |
| 14 | Australia | 1,075 |
| 15 | South Korea | 1,050 |
| 16 | Belgium | 848 |
| 17 | Poland | 745 |
| 18 | Netherlands | 639 |
| 19 | Indonesia | 639 |
| 20 | Austria | 512 |
| 21 | Russia | 507 |
| 22 | Israel | 502 |
| 23 | Argentina | 485 |
| 24 | Saudi Arabia | 446 |
| 25 | Switzerland | 442 |
| 26 | Greece | 421 |
| 27 | Türkiye | 418 |
| 28 | Thailand | 387 |
| 29 | South Africa | 379 |
| 30 | Egypt | 374 |
Measured against the size of its economy, however, the picture changes considerably. At roughly 126% of GDP, the U.S. national debt ranks behind countries including Japan, Singapore, Italy, and Greece.
The U.S. also benefits from issuing the world’s primary reserve currency, which helps sustain global demand for dollar-denominated assets. U.S. Treasury securities are widely regarded as among the world’s safest investments.
Japan remains a clear outlier, with government debt projected to exceed 204% of GDP in 2026. While a ratio this high would raise concerns in many countries, Japan’s large domestic investor base and broader financial system help shape how markets assess its debt sustainability.
| Rank | Country | 2026 Government debt as a share of GDP (%) |
|---|---|---|
| 1 | Japan | 204.4% |
| 2 | Singapore | 171.9% |
| 3 | Sudan | 169.1% |
| 4 | Bahrain | 152.4% |
| 5 | Italy | 138.4% |
| 6 | Greece | 136.9% |
| 7 | Senegal | 132.3% |
| 8 | Maldives | 129.4% |
| 9 | United States | 125.8% |
| 10 | Ukraine | 122.6% |
| 11 | Bhutan | 120.3% |
| 12 | Saint Vincent and the Grenadines | 120.1% |
| 13 | France | 118.4% |
| 14 | Canada | 110.7% |
| 15 | Belgium | 109.2% |
| 16 | China | 106.9% |
| 17 | Mozambique | 106.1% |
| 18 | United Kingdom | 103.6% |
| 19 | Bolivia | 102.7% |
| 20 | Dominica | 98.3% |
| 21 | Spain | 98.2% |
| 22 | Brazil | 96.5% |
| 23 | Cabo Verde | 95.9% |
| 24 | Finland | 93.1% |
| 25 | Republic of the Congo | 91.3% |
| 26 | Barbados | 89.5% |
| 27 | Suriname | 87.1% |
| 28 | Egypt | 87.0% |
| 29 | Mauritius | 86.5% |
| 30 | Gabon | 86.1% |
Japan is followed by Singapore, Sudan at 169%, and Bahrain at 152%. However, debt-to-GDP ratios alone do not indicate how much trust global financial markets place in a government.
Investors also consider factors such as a government’s fiscal record, credit rating, political stability, and access to financing. Countries such as Bolivia, at 103% of GDP, or Mozambique, at 106%, may face greater borrowing challenges than more established economies such as Singapore, despite Singapore’s higher debt ratio.
Several major European economies are carrying sizable fiscal deficits and elevated government debt.
Greece and Italy both have debt exceeding 135% of their respective GDPs. However, Italy’s $3.8 trillion in government debt remains lower than the totals held by France and the UK, whose debt-to-GDP ratios stand at 118% and 104%, respectively.
Spain’s government debt is projected at $2.1 trillion in 2026, equal to roughly 98% of GDP. This places its relative debt burden below those of several other major European economies.
Germany, meanwhile, has used a constitutional “debt brake” to limit structural deficits. Europe’s largest economy is projected to hold $3.5 trillion in government debt in 2026, less than France, Italy, and the UK.
The post Ranked: Countries With the Most Government Debt in 2026 appeared first on Activist Post.

Migration debates often focus on countries that receive large numbers of newcomers. Across much of the world, however, immigrants remain exceptionally rare.
Using 2024 data from the UN Population Division’s International Migrant Stock, this map highlights countries and territories where foreign-born residents make up less than 1% of the population.
Here is the full dataset showing international migrants as a share of each country or territory’s population:Search:
| Country/Territory | Migrant population share (%, 2024) |
|---|---|
| Cuba | 0.02 |
| Philippines | 0.08 |
| China | 0.12 |
| Madagascar | 0.12 |
| Myanmar | 0.15 |
| Indonesia | 0.16 |
| Haiti | 0.17 |
| Sri Lanka | 0.18 |
| North Korea | 0.19 |
| Afghanistan | 0.23 |
| Morocco | 0.29 |
| Papua New Guinea | 0.29 |
| Solomon Islands | 0.30 |
| Vietnam | 0.32 |
| India | 0.33 |
| Eritrea | 0.35 |
| Honduras | 0.37 |
| Somalia | 0.41 |
| Cambodia | 0.48 |
| Guatemala | 0.50 |
| Tunisia | 0.51 |
| Algeria | 0.55 |
| Sierra Leone | 0.58 |
| Timor-Leste | 0.59 |
| Nigeria | 0.60 |
| Nicaragua | 0.63 |
| Lesotho | 0.64 |
| Mongolia | 0.65 |
| Laos | 0.66 |
| Brazil | 0.66 |
| Tanzania | 0.67 |
| El Salvador | 0.68 |
| Guinea-Bissau | 0.68 |
| Guinea | 0.80 |
| Iraq | 0.81 |
| Sao Tome and Principe | 0.83 |
| Jamaica | 0.85 |
| Malawi | 0.86 |
| Ethiopia | 0.88 |
| Western Sahara | 0.95 |
| Yemen | 0.97 |
| Egypt | 0.98 |
| DR Congo | 0.99 |
| Vanuatu | 1.01 |
| Mozambique | 1.02 |
| Bosnia and Herzegovina | 1.08 |
| Zambia | 1.17 |
| Liberia | 1.29 |
| Mexico | 1.32 |
| Comoros | 1.44 |
| Bolivia | 1.48 |
| Senegal | 1.52 |
| Ghana | 1.55 |
| Fiji | 1.55 |
| Nepal | 1.59 |
| Albania | 1.66 |
| Niger | 1.66 |
| Pakistan | 1.66 |
| Bangladesh | 1.67 |
| Kenya | 1.76 |
| Samoa | 1.76 |
| Central African Republic | 1.77 |
| Angola | 1.79 |
| Azerbaijan | 2.11 |
| Georgia | 2.14 |
| Cameroon | 2.21 |
| Mali | 2.23 |
| Mauritius | 2.29 |
| Kiribati | 2.45 |
| Tuvalu | 2.55 |
| Micronesia | 2.56 |
| Zimbabwe | 2.58 |
| Turkmenistan | 2.59 |
| Paraguay | 2.61 |
| Tajikistan | 2.61 |
| Eswatini | 2.68 |
| Kyrgyzstan | 2.71 |
| Japan | 2.76 |
| Burundi | 2.76 |
| Benin | 2.89 |
| Togo | 2.96 |
| Burkina Faso | 3.14 |
| Cape Verde | 3.15 |
| Uzbekistan | 3.18 |
| Tonga | 3.44 |
| Romania | 3.45 |
| South Korea | 3.50 |
| Rwanda | 3.60 |
| Syria | 3.63 |
| Mauritania | 3.79 |
| Namibia | 3.83 |
| South Africa | 4.11 |
| Uganda | 4.11 |
| Ecuador | 4.12 |
| Iran | 4.19 |
| Argentina | 4.28 |
| Bulgaria | 4.43 |
| Thailand | 4.44 |
| Venezuela | 4.45 |
| Saint Lucia | 4.49 |
| Poland | 4.51 |
| Botswana | 4.62 |
| Uruguay | 4.73 |
| Sudan | 4.75 |
| Saint Vincent and the Grenadines | 4.79 |
| Taiwan | 4.90 |
| Palestine | 4.96 |
| Russia | 5.25 |
| Peru | 5.37 |
| Colombia | 5.79 |
| Slovakia | 5.88 |
| Congo | 6.09 |
| Lithuania | 6.13 |
| Moldova | 6.20 |
| Chad | 6.25 |
| Grenada | 6.26 |
| Dominican Republic | 6.46 |
| Guyana | 6.52 |
| Puerto Rico | 6.89 |
| Bhutan | 7.04 |
| Hungary | 7.13 |
| Trinidad and Tobago | 7.53 |
| South Sudan | 7.65 |
| Chile | 7.78 |
| Türkiye | 8.10 |
| Suriname | 8.18 |
| North Macedonia | 8.28 |
| Gambia | 8.56 |
| Marshall Islands | 8.81 |
| Côte d’Ivoire | 9.02 |
| Finland | 9.16 |
| Armenia | 9.24 |
| Saint Helena | 9.39 |
| Czechia | 9.55 |
| Kazakhstan | 10.15 |
| Seychelles | 10.17 |
| Greenland | 10.41 |
| Serbia | 10.58 |
| Panama | 10.58 |
| French Polynesia | 10.68 |
| Malaysia | 10.71 |
| Djibouti | 10.78 |
| Portugal | 10.81 |
| Italy | 11.04 |
| Belarus | 11.64 |
| Latvia | 11.78 |
| Libya | 12.16 |
| Costa Rica | 12.25 |
| Barbados | 12.46 |
| Dominica | 12.75 |
| Equatorial Guinea | 13.15 |
| Ukraine | 13.38 |
| Croatia | 13.62 |
| France | 13.80 |
| Greece | 14.17 |
| Denmark | 14.18 |
| Maldives | 14.23 |
| Montenegro | 14.45 |
| Faroe Islands | 14.62 |
| Slovenia | 14.87 |
| Cyprus | 14.88 |
| Estonia | 14.92 |
| United States | 15.16 |
| Réunion | 15.43 |
| Netherlands | 16.22 |
| Belize | 16.47 |
| Bahamas | 16.77 |
| Saint Kitts and Nevis | 16.99 |
| United Kingdom | 17.13 |
| San Marino | 17.38 |
| Gabon | 17.71 |
| Saint Pierre and Miquelon | 17.91 |
| Wallis and Futuna | 18.02 |
| Norway | 18.15 |
| Spain | 18.51 |
| Germany | 19.81 |
| Martinique | 19.87 |
| Belgium | 20.01 |
| Nauru | 21.33 |
| Sweden | 21.42 |
| Canada | 22.16 |
| Israel | 22.28 |
| Ireland | 23.14 |
| Guadeloupe | 23.89 |
| Lebanon | 24.50 |
| Iceland | 25.12 |
| Austria | 25.51 |
| Brunei | 25.92 |
| New Caledonia | 26.22 |
| New Zealand | 28.16 |
| Gibraltar | 28.71 |
| Palau | 29.45 |
| Australia | 30.36 |
| Switzerland | 31.09 |
| Bermuda | 31.21 |
| Montserrat | 31.94 |
| Niue | 32.33 |
| Antigua and Barbuda | 32.50 |
| Cook Islands | 35.96 |
| Malta | 36.97 |
| Saudi Arabia | 40.29 |
| Anguilla | 40.54 |
| Hong Kong | 41.31 |
| French Guiana | 42.44 |
| Cayman Islands | 42.89 |
| Curaçao | 43.14 |
| Oman | 43.23 |
| Mayotte | 43.96 |
| Jordan | 45.70 |
| Singapore | 48.72 |
| Northern Mariana Islands | 49.69 |
| Guam | 50.16 |
| American Samoa | 50.64 |
| Tokelau | 51.16 |
| Luxembourg | 51.16 |
| Isle of Man | 51.92 |
| Bahrain | 52.28 |
| Andorra | 59.08 |
| Macau | 59.26 |
| Turks and Caicos Islands | 61.15 |
| British Virgin Islands | 62.12 |
| U.S. Virgin Islands | 66.87 |
| Falkland Islands (Malvinas) | 67.23 |
| Kuwait | 67.35 |
| Aruba | 68.01 |
| Liechtenstein | 69.40 |
| Sint Maarten (Dutch part) | 69.55 |
| Monaco | 70.17 |
| United Arab Emirates | 73.97 |
| Qatar | 76.66 |
| Vatican City | 100.00 |
Cuba has the lowest migrant share in the dataset at just 0.02%, followed by the Philippines at 0.08%. China and Madagascar each stand at 0.12%.
In practical terms, a migrant share below 1% means that a randomly selected group of 100 residents would typically include fewer than one person born in another country.
Several of these countries have some of the world’s largest populations, including China, India, Indonesia, and Nigeria. Their size helps explain why nearly three-fifths of humanity lives in places where international migrants have a minimal demographic presence.
Japan is frequently viewed as the archetype of a low-immigration society. Yet migrants account for roughly 3% of its population, well above the cutoff for this map. Every country highlighted here has an even smaller foreign-born share.
The map captures only the lowest end of the spectrum. Another 38 countries and territories have migrant shares between 1% and 3%, bringing the total with shares below 3% to 81.
That picture contrasts sharply with countries such as Canada, Australia, and Switzerland, where migrants account for a substantial share of residents and where foreign-born populations have grown significantly.
International migrants also tend to remain relatively close to home. According to Our World in Data, roughly 47% move less than 500 kilometers (about 300 miles), while most stay on the same continent.
Together, these patterns show that international migration is concentrated in a comparatively small number of destinations, including the countries that host the largest migrant populations today.
The post Countries Where Migrants Make Up Less Than 1% of the Population appeared first on Activist Post.

See visuals like this from many other data creators on our Voronoi app. Download it for free on iOS or Android and discover incredible data-driven charts from a variety of trusted sources.
A small group of countries controls the world’s largest reserves of many of the minerals that power modern economies.
This map shows the top reserve-holding country for 18 key minerals, from iron ore and copper to rare earths and cobalt. In several cases, a single nation accounts for an outsized share of global reserves, creating potential supply chain bottlenecks and geopolitical leverage.
The data for this visualization comes from the U.S. Geological Survey’s Mineral Commodity Summaries 2026 and the World Nuclear Association.
While some countries dominate a single resource, Australia stands out for the breadth of its mineral wealth. It ranks first globally in reserves of five major commodities, giving it one of the most diversified resource bases in the world.
The country ranks first in reserves of gold, uranium, iron ore, zinc, and manganese.
| Mineral | Largest reserves | Share |
|---|---|---|
| Gold | Australia | 20% |
| Silver | Peru | 18% |
| Copper | Chile | 21% |
| Uranium | Australia | 28% |
| Diamond | Russia | 44% |
| Coal | U.S. | 23% |
| Lithium | Chile | 25% |
| Iron ore | Australia | 31% |
| Bauxite (Aluminum) | Guinea | 26% |
| Rare Earth | China | 52% |
| Nickel | Indonesia | 44% |
| Cobalt | DRC | 50% |
| Phosphate | Morocco | 69% |
| Graphite | China | 32% |
| Zinc | Australia | 27% |
| Potash | Canada | 45% |
| Manganese | Australia | 32% |
| Platinum-Group Metals | South Africa | 83% |
Its dominance in iron ore is particularly significant, with 31% of global reserves.
Australia is also home to 28% of the world’s uranium reserves, making it an important player in the future of nuclear energy.
China leads global reserves of both rare earth elements and graphite, two minerals that sit at the center of modern industrial supply chains.
Together, they support technologies ranging from EV batteries and wind turbines to semiconductors and advanced defense systems.
Rare earths are especially important because they are difficult to substitute in many advanced technologies.
Some of the world’s most important mineral reserves are concentrated in just one country. South Africa holds 83% of global platinum-group metal reserves, Morocco controls 69% of phosphate reserves, and the Democratic Republic of Congo accounts for half of global cobalt reserves. This concentration can make global supply chains highly dependent on a small number of producers.
Meanwhile, Indonesia holds 44% of nickel reserves, another key ingredient in electric vehicle batteries.
The post Mapped: Which Countries Hold the Biggest Mineral Reserves? appeared first on Activist Post.

See visuals like this from many other data creators on our Voronoi app. Download it for free on iOS or Android and discover incredible data-driven charts from a variety of trusted sources.
How a country is viewed abroad can influence everything from tourism and investment to diplomacy and soft power. While countries such as Switzerland, Canada, and Japan enjoy strongly positive global reputations, others face much more negative perceptions.
This graphic ranks 65 countries by their average net perception score, calculated by subtracting negative views from positive views.
The data comes from the Democracy Perception Index 2026, which surveyed more than 46,000 respondents across 85 countries.
Switzerland and Canada top the global rankings with net perception scores of +36, followed closely by Japan (+34) and Sweden (+33).
Of the top 15 best-perceived countries, over two-thirds are located in Europe. Member countries of the European Union, meanwhile, average out to around +26. This average is brought down substantially by France’s relatively low +11 score, which it shares with the United Kingdom.
This data table lists countries based on their net perception globally.
The positive global perception of Canada and European countries like Switzerland and Italy (+32) may reflect a mix of factors, including domestic stability, quality of life, diplomatic positioning, and relatively open societies.
Positive perceptions also extend to other developed countries beyond the North Atlantic, including Australia and New Zealand (both +30), as well as major Asian economies such as Singapore and South Korea (both +21).
The United States stands out as a major outlier in the rankings. Despite being the world’s largest economy and one of its most influential countries, it receives a net perception score of -16, placing it among the five lowest-ranked nations in the survey.
While the global view of the U.S. has always been complex, shaped by immigration, culture, and foreign policy, it has deteriorated notably over the last decade. Under the Donald Trump administrations (2017-2021, 2025-present), surveys have consistently reflected a worsening of global public opinion of, and trust in, the United States.
As of 2026, the U.S. does not find itself in the company of peers like Germany, Japan, or even the United Kingdom. Instead, it ranks near countries such as Iran (-17) and Iraq (-13), both of which have long-standing geopolitical tensions with the U.S.
The U.S. is not alone in netting a negative perception score. India (-2) and Pakistan (-9) both received more negative responses than positive, as did Nigeria (-3), Russia (-11), and Saudi Arabia (-1).
No country fares worse than Israel, which has a -24 net perception score. Controversy around the country has grown in recent years owing to its conflicts in Gaza as well as Lebanon, Syria, and most notably Iran.
As a result, Israel records the lowest net perception score in the survey. It ranks below every other country evaluated, including Afghanistan and North Korea (both -19), underscoring how sharply global opinion has shifted in recent years.
The post Ranked: The World’s Most and Least Liked Countries appeared first on Activist Post.

See visuals like this from many other data creators on our Voronoi app. Download it for free on iOS or Android and discover incredible data-driven charts from a variety of trusted sources.
The countries carrying the world’s largest refugee burden are often not the ones most people expect.
Using data from the UNHCR via Our World in Data, this graphic ranks countries by the number of refugees hosted per 1,000 residents in 2024.
The results reveal how proximity to conflict frequently matters more than economic size. Many of the countries at the top of the ranking border active war zones and have absorbed large refugee populations relative to their own populations.
Roughly two-thirds of the world’s refugees remain in neighboring countries, helping explain why several relatively small nations rank ahead of much larger economies.
Rather than being distributed across the world’s wealthiest countries, refugee populations are often concentrated in states that share borders with major conflicts. The ranking below shows which countries carry the largest refugee burden relative to their population.
Lebanon tops the ranking by a wide margin, hosting 130.7 refugees per 1,000 residents. Put differently, about one out of every eight people living in the country is a refugee, the highest ratio in the world.
Its position reflects the country’s proximity to Syria, which has produced one of the world’s largest refugee crises since civil war broke out in 2011. Over the past decade, millions of Syrians have sought refuge in neighboring countries, with Lebanon absorbing one of the largest shares relative to its population.
The country has also faced mounting economic and political challenges of its own. More recently, fighting between Israel and Hezbollah displaced more than one million people within Lebanon, adding further strain to public services and infrastructure.
Taken together, these pressures help explain why Lebanon remains one of the countries most affected by displacement anywhere in the world.
Many of the countries hosting the largest refugee populations are located near active conflicts or regions experiencing prolonged instability.
Jordan and Lebanon border Syria. Moldova shares a border with Ukraine. Chad hosts refugees from neighboring Sudan, while Uganda has long received people fleeing violence in South Sudan and the Democratic Republic of Congo.
The pattern helps explain why many smaller countries appear near the top of the ranking despite having far fewer economic resources than larger developed nations.
For refugees, crossing a nearby border is often the fastest and safest option. As a result, neighboring countries frequently absorb the largest influxes long before refugees are resettled elsewhere.
At first glance, America’s ranking may seem surprisingly low.
The United States hosts hundreds of thousands of refugees and remains the world’s 18th-largest refugee destination in absolute terms. However, its population of more than 340 million significantly changes the picture.
When refugee numbers are adjusted for population size, the U.S. hosts roughly 1.3 refugees per 1,000 residents, placing it 82nd globally.
The gap highlights why per-capita measures can reveal a different reality than headline totals. While large countries often host more refugees overall, smaller nations can experience a much greater impact relative to their population size.
The number of forcibly displaced people worldwide has surpassed 120 million, nearly double the level seen a decade ago. Conflicts in Ukraine, Sudan, Syria, and other regions continue to drive displacement across borders.
For host countries, the impact extends beyond humanitarian assistance. Large refugee populations can increase demand for housing, healthcare, education, infrastructure, and public services, particularly in smaller countries with limited resources.
The ranking highlights a reality often overlooked in global migration debates: the countries carrying the largest refugee burden are frequently those located closest to conflict, not necessarily those with the largest economies.
The post Ranked: Refugees Hosted Per Capita by Country appeared first on Activist Post.
This was originally posted on our Voronoi app. Download the app for free on iOS or Android and discover incredible data-driven charts from a variety of trusted sources.
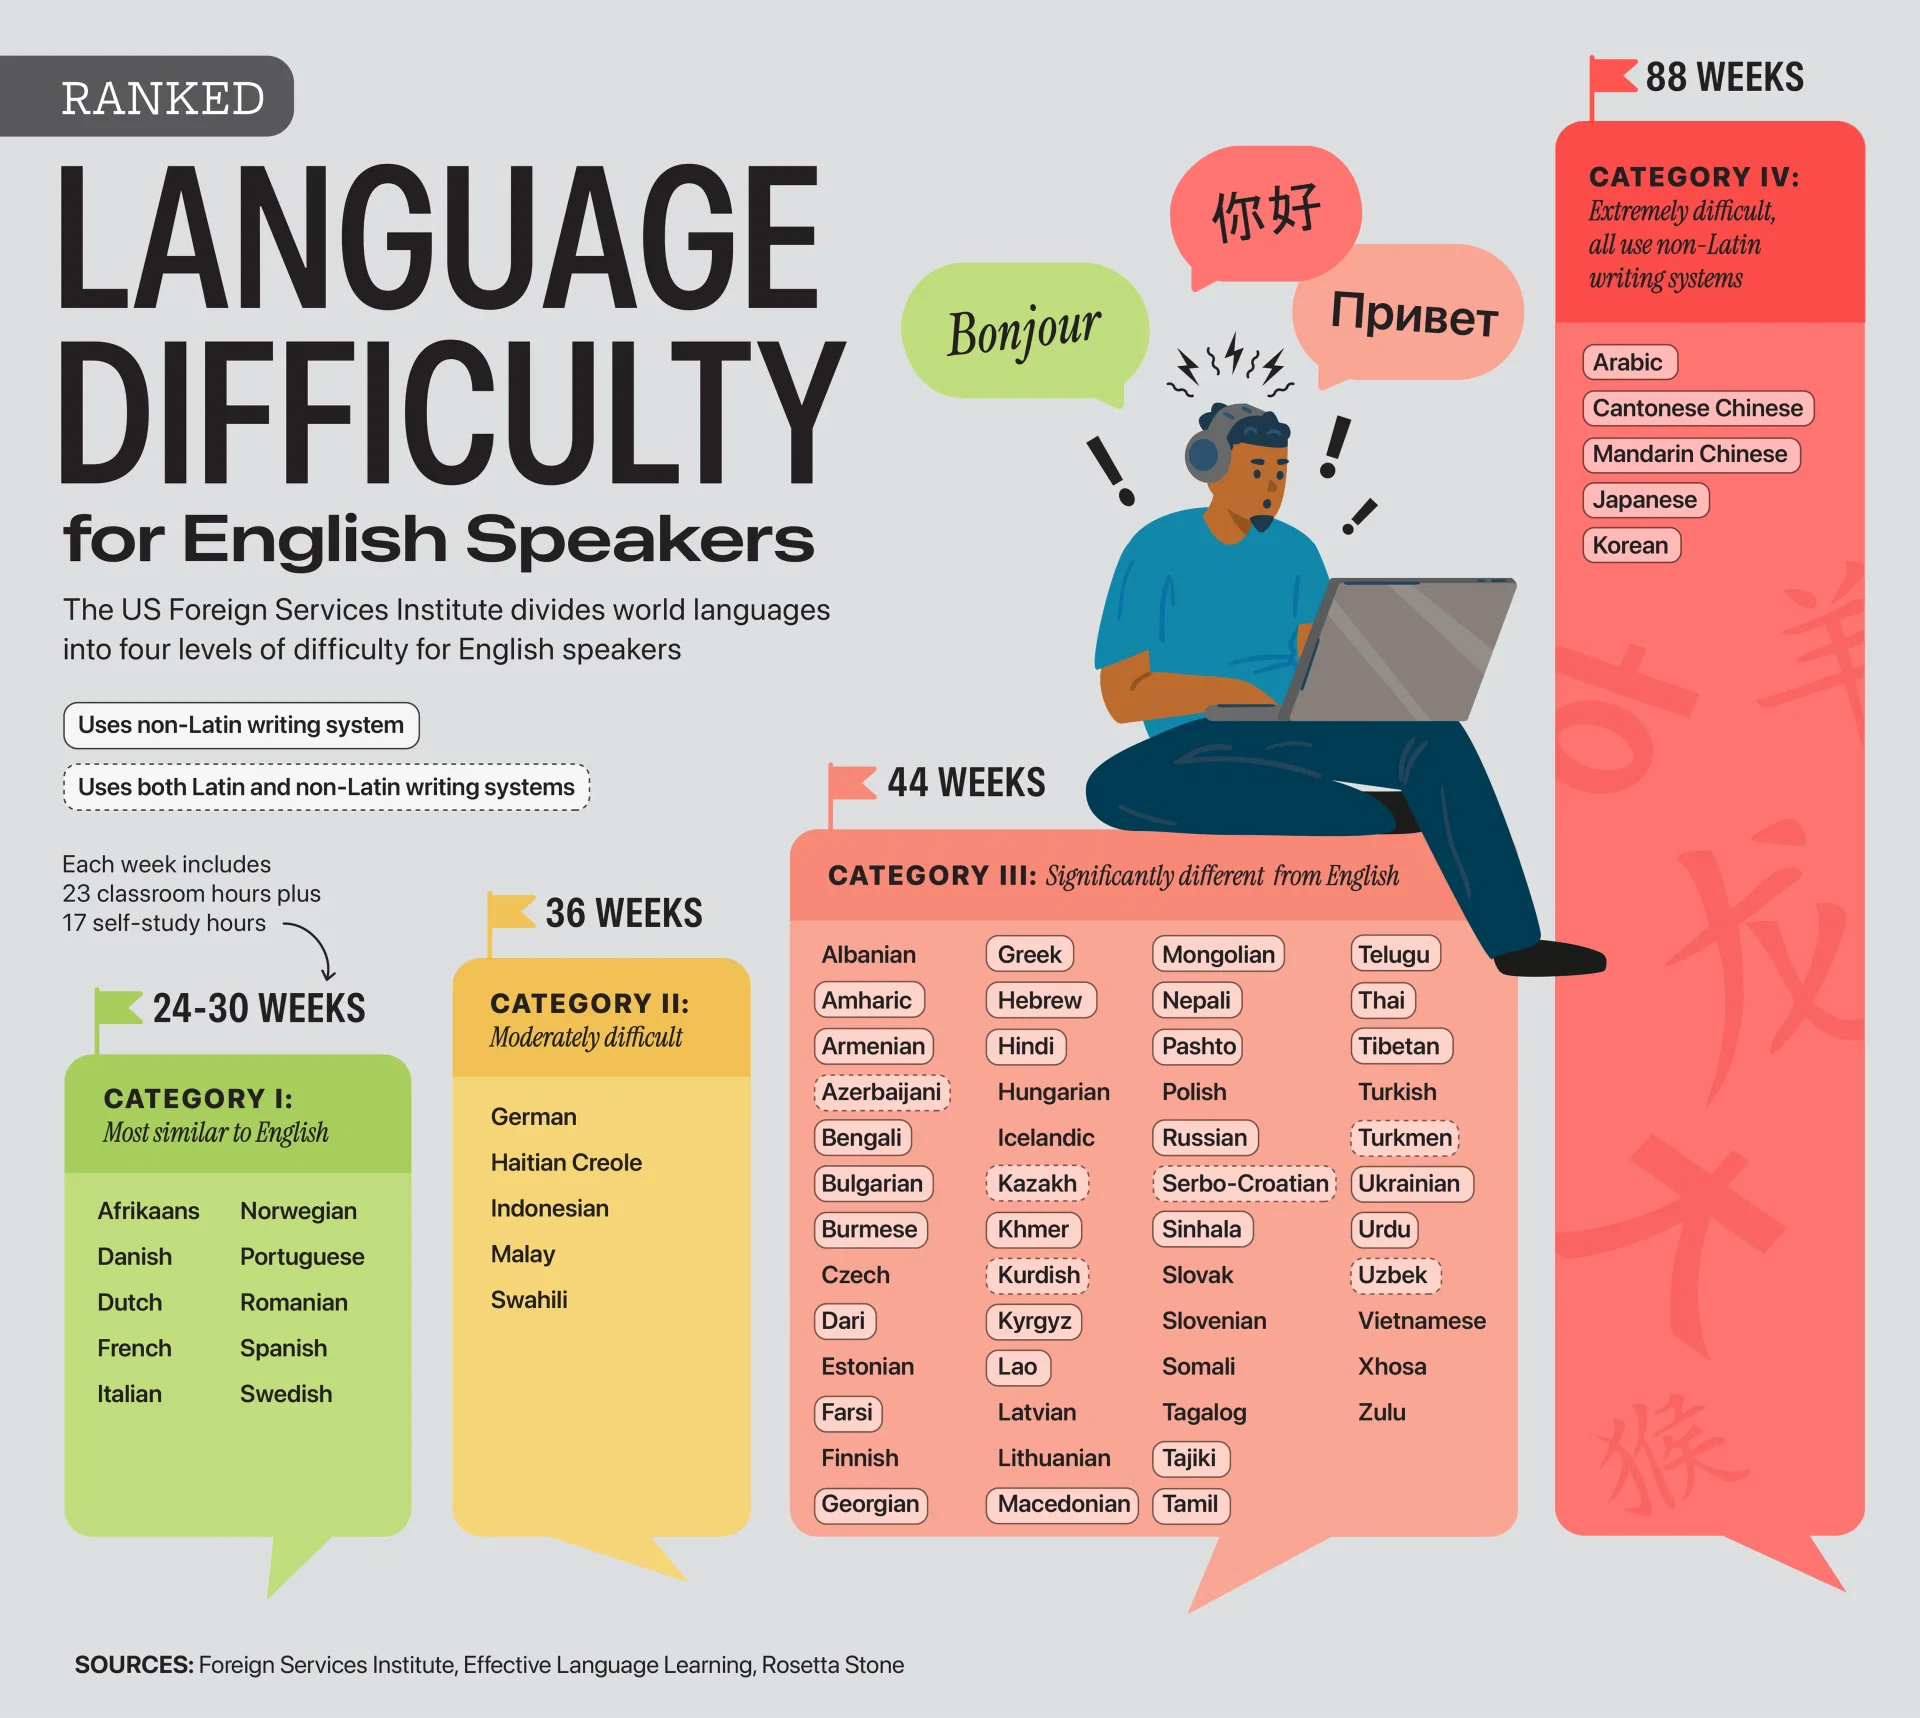
For English speakers, learning Spanish or Italian can take less than a year. Reaching the same level of proficiency in Japanese, Korean, Mandarin, or Arabic may require nearly four times as much study.
This wide gap reflects how closely a language resembles English in its vocabulary, grammar, sounds, and writing system.
This visualization, created by Julie R. Peasley, ranks languages by difficulty using categories and study-time estimates from Effective Language Learning and Rosetta Stone, which reference Foreign Service Institute-style benchmarks.
Languages are generally easier to learn when they share familiar grammar, vocabulary, sounds, or writing systems. That’s why many Category I languages, including Spanish, French, Italian, Dutch, and Swedish, are considered relatively approachable.
The data table below shows the difficulty rankings and estimated learning time for 70 different languages:
One of the most striking findings is the size of the gap between the easiest and hardest languages. While Spanish or French can often be learned in 24–30 weeks, mastering Japanese, Korean, Mandarin, or Arabic may require roughly 88 weeks of study.
Many Category I languages use the Latin alphabet and share vocabulary roots with English through Germanic or Romance-language connections.
This may also help explain why European languages often rank highly in language-learning apps and why Duolingo’s most popular languages globally include several widely taught European options.
Category III languages tend to have greater linguistic distance from English. This can include unfamiliar grammar structures, new alphabets, or pronunciation patterns that require more time to master.
For example, languages like Russian, Greek, Hindi, Turkish, and Vietnamese all fall into this category. Some use different scripts, while others introduce grammatical systems that are less intuitive for native English speakers.
Category IV languages are considered exceptionally difficult for English speakers. This group includes Arabic, Cantonese, Mandarin, Japanese, and Korean.
Many of these languages present multiple learning hurdles simultaneously. Mandarin and Cantonese require mastery of tones, Japanese combines several writing systems, Korean introduces a unique alphabet and grammar structure, and Arabic uses an entirely different script. Together, these differences significantly increase the time needed to reach professional proficiency.
The post Ranked: The Hardest Languages for English Speakers to Learn appeared first on Activist Post.
See visuals like this from many other data creators on our Voronoi app. Download the app for free on iOS or Android and discover incredible data-driven charts from a variety of trusted sources.
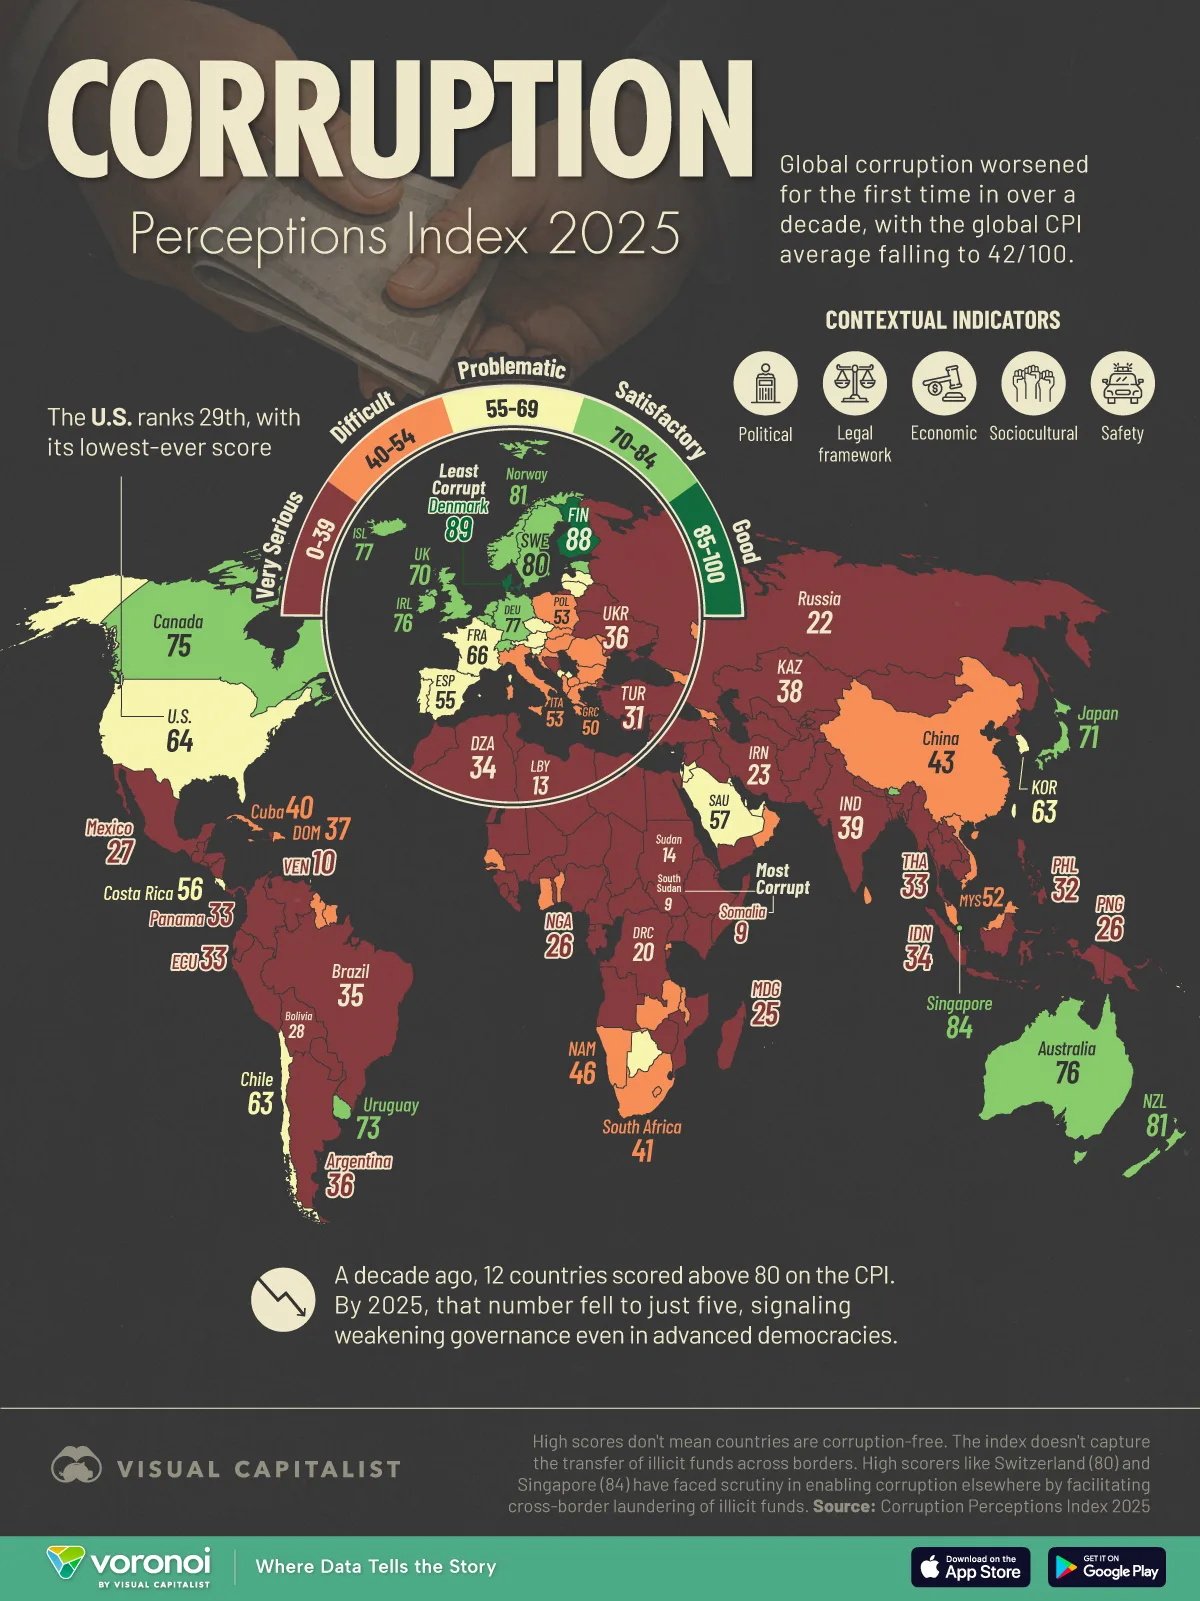
Corruption perceptions are worsening globally, according to the latest Corruption Perceptions Index (CPI) from Transparency International.
The index scores countries from 0 to 100, with higher scores indicating cleaner perceived public sectors. In 2025, the global average fell to 42, while 122 of 182 countries scored below 50.
This map shows how corruption perceptions compare worldwide, from Denmark’s score of 89 to Somalia’s score of 9.
One of the most striking findings is how rapidly the number of top-performing countries has shrunk. In 2015, 12 countries scored above 80 on the CPI. By 2025, that number had fallen to just five.
This shift suggests that even nations traditionally associated with strong democratic institutions are facing mounting governance pressures. Transparency International points to rising political polarization, weaker institutional trust, and pressure on checks and balances as factors weighing on scores in several advanced economies.
The U.S. is one of the clearest examples of this shift. With a score of 64, it ranks 29th globally and has fallen to its lowest score in the index. The decline reflects growing concerns around transparency and institutional confidence.
Corruption carries steep economic costs beyond political instability. Research published by the International Monetary Fund has linked corruption to lower investment, weaker economic growth, and reduced government effectiveness.
In many countries, corruption also distorts public spending priorities. Funds intended for infrastructure, health care, education, or climate adaptation can instead be siphoned away through bribery schemes or opaque procurement systems.
The effects are often most severe in lower-income countries, where weaker institutions leave governments more vulnerable to organized crime and state capture.
Beyond economics, corruption also creates significant human risks. Anti-corruption reporting remains especially dangerous in countries with weak governance protections. Since 2012, 150 journalists covering corruption stories outside of war zones have been murdered, with nearly all cases occurring in countries with high corruption levels.
International organizations including the United Nations Office on Drugs and Crime continue to emphasize that fighting corruption requires stronger legal institutions, independent media protections, and cross-border cooperation.
While some countries continue to improve transparency and accountability, the broader global picture suggests corruption remains deeply entrenched and increasingly difficult to reverse.
Explore more global governance and public opinion data on Voronoi, including this visualization of Which Countries Are The Most Corrupt?.
The post Mapped: The World’s Most and Least Corrupt Countries appeared first on Activist Post.
See visuals like this from many other data creators on our Voronoi app. Download it for free on iOS or Android and discover data-driven charts from a variety of trusted sources.
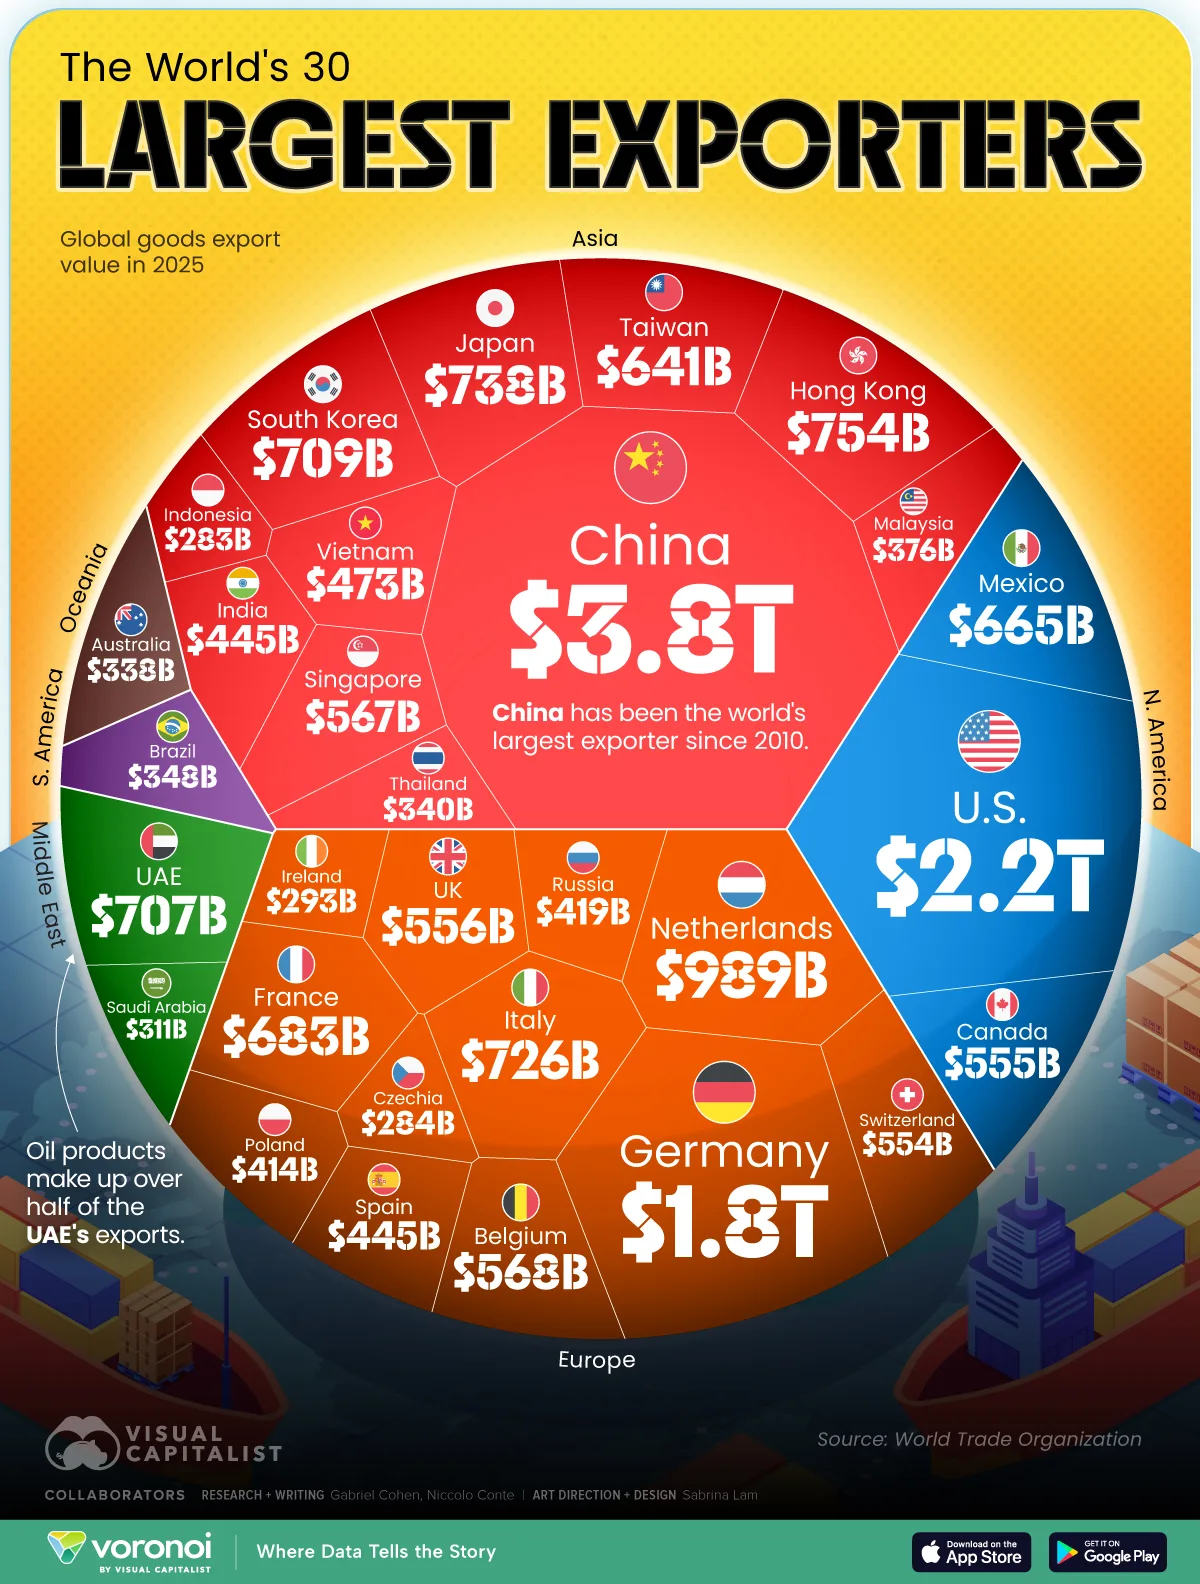
Global trade is dominated by a handful of export powerhouses—but the scale gap between them is striking.
China exported nearly $3.8 trillion in goods in 2025, maintaining a wide lead over the United States and every other economy. Meanwhile, Europe collectively accounts for a massive share of global exports, and smaller trade hubs like the Netherlands and UAE continue to punch far above their weight.
This graphic ranks the world’s 30 largest exporters using the latest data from the World Trade Organization.
China’s $3.8 trillion in exports is nearly double that of the United States, underscoring the scale of its dominance in global manufacturing and trade.
Beginning with the country’s gradual liberalization in the late 1970s and 1980s, China pursued an export-driven growth model that sought to position the country as “the world’s factory floor.” Today, no country ships more merchandise abroad.
This data table lists the world’s top exporters and their 2025 goods export value.
China’s expansive exports have been boosted by its various free-trade agreements, including with Australia, Pakistan, South Korea, and the ASEAN bloc of Southeast Asian markets.
The effect is undeniable: China is today the largest trade partner of over half the world’s countries, playing an increasingly central commercial role for developed and emerging markets across all continents.
The United States may be best known today as the world’s largest import market, but it’s also responsible for over $2.2 trillion worth of diversified exports including cars, oil, soy, and medical products.
The top U.S. trade partners include its North American neighbors, Canada and Mexico, as well as China, Germany, and Japan.
Integrated North American supply chains mean that many U.S. exports actually obtain their inputs from imports across the border. Car parts, for example, may cross a U.S. border with either Canada or Mexico some six to eight times during the vehicle assembly process.
Gulf states like Saudi Arabia ($311 billion) and the United Arab Emirates ($707 billion) also punch quite above their weight as exporters, aided by their sprawling hydrocarbon reserves.
Oil products make up nearly 75% of Saudi exports and over half of Emirati exports, in contrast to the less than 20% share seen in the U.S., the world’s largest oil producer.
The Gulf countries’ high dependence on their petroleum production thus makes them vulnerable to geopolitical tensions and supply chain disruptions in the Middle East, with the ongoing conflict involving Iran emerging as a clear example.
The post Ranked: The World’s Largest Exporters in 2025 appeared first on Activist Post.


 Lateo.net - Flux RSS en pagaille (pour en ajouter : @ moi)
