 Connexion


Young people see and use artificial intelligence (AI) systems frequently, and hear a lot about how they are applied across many areas of life. That makes them understandably eager to find out more about how AI works. For some, this interest extends to wanting to experiment with the technology to investigate their own questions and build something themselves. How can schools support learners who want to take their interest further and gain recognition for the knowledge and skills they develop along the way?

For learners in the UK, there is currently no established qualification that develops technical AI skills. This can make it difficult to create space in the curriculum for dedicated AI learning, especially for learners from age 14, for whom preparation for high-stakes exams is prioritised over non-examined learning.
We have been working over the past year to develop a research-informed curriculum framework for data science, which lays out many of the foundational skills and knowledge needed to understand and develop AI models. Alongside this, we have been making the case in England for a Level 3 qualification in data science and AI. However, establishing a new qualification can take years.
In the meantime, we are starting to support students in England who choose an established route for extending their skills and getting that effort recognised: the Extended Project Qualification (EPQ).
The EPQ is a well-established qualification for 16- to 19-year-olds offered in England, Northern Ireland, and Wales by several exam boards (including AQA, Pearson Edexcel, OCR, Eduqas/WJEC, and City & Guilds). It is completed by around 1 in 10 learners at this stage of education.
Learners pursuing an EPQ undertake an extended, self-directed investigation or project. They choose an area of interest where they want to develop their own project and take responsibility for planning, completing, and evaluating the project work.
Its self-directed nature makes the EPQ particularly well suited to learners who want to explore emerging areas, such as artificial intelligence and data science. For students fascinated by AI, an EPQ offers an opportunity to do more than simply learn about the technology. With the right foundations and support, they can investigate a question of their own, build a machine learning model, and use that work to gain a recognised qualification.
We are now working to offer those foundations through a new introductory ‘Data Science and AI’ course that will enable learners to build a machine learning model as their EPQ artefact.
Creating a machine learning model involves much more than choosing a statistical technique and using easily available training data. It involves understanding the problem being addressed, deciding what data to use, exploring and preparing that data, building and evaluating a model, and interpreting the model’s outputs.
Learners who want to do this work for their EPQ need not only technical knowledge and skills, but also skills for critical thinking, research, decision-making, evaluation, and reflection — skills that are valuable for any further study and future career.
To help learners develop these foundations, we are creating an introductory ‘Data Science and AI’ course, based on our curriculum framework for data science and designed to be completed before learners begin their AI-focused EPQ.
The course will guide students through a structured investigation based on a recognised data science lifecycle. By working through it, students will:
The course will consist of 10 units, each involving 2 to 3 hours of independent study for learners. We are designing the activities with a no-code approach to allow students to focus on understanding data science concepts and processes.
Importantly, the work learners produce during this course won’t be the EPQ investigation itself. Working through ‘Data Science and AI’ will give learners the knowledge and skills they need to undertake an AI-focused project with greater independence and confidence.
After they have completed the course, when they begin their EPQ project pursuing a question that interests them, students can apply their new skills and knowledge to make decisions about their AI investigation and document their progress.
We are looking forward to supporting learners in England to turn their interest in one of today’s most significant technologies into the opportunity to develop independent research and project skills through a recognised qualification.
The ‘Data Science and AI’ course will be available to selected schools in England from September 2026, where students and teachers will test the materials and we will learn from their feedback to improve the course materials. We plan to make the course freely available in 2027.
The post Supporting a technical AI-focused qualification for young people in England appeared first on Raspberry Pi Foundation.
The development of AI and data science has transformed how we gain insights from data. In healthcare, AI tools are being used in the development of new treatments as researchers apply machine learning methods to datasets. However, applying AI in healthcare also brings risks, particularly when systems amplify existing biases in data or design.
In our fourth seminar in our current series on teaching about AI in the arts, humanities, and sciences, Kathy Jessen Eller (The Concord Consortium) introduced the Data Science, AI & You (DSAIY) programme, a high school curriculum that helps students critically evaluate the role of data and AI in healthcare.
Kathy began her seminar by arguing that for many students who use AI tools in their coursework, questions remain about whether they are critically evaluating the tools’ outputs. Students may or may not check an AI-generated answer against primary sources to see if the answer is accurate. There is also growing concern that students’ use of AI tools lets them offload cognitive work rather than engage in deeper thinking. This presents a challenge for educators: how do we help students use AI productively while still supporting them to develop the critical judgement needed to evaluate its outputs?
To tackle this challenge, Kathy and her colleagues have developed the Data Science, AI & You (DSAIY) programme (pronounced ‘Daisy’). DSAIY is a semester-long high school curriculum designed to introduce students to AI by actively engaging them in the machine learning process.
The programme introduces machine learning as the engine behind many AI tools, and introduces the concept of bias through real-world examples. Students use a variety of tools to collect and prepare data, train, test, and evaluate models. It culminates in an ‘AI-a-thon’ where young people work in cross-disciplinary teams alongside data scientists, clinicians, and their own teachers to gain real-world experience.
At the time of the seminar, 11 teachers had delivered the programme to over 800 students across a variety of settings in Rhode Island, USA. Teachers are heavily supported with four days of professional development and ongoing technical assistance throughout implementation. The students that took part had a wide variety of prior experience, including many with no prior background in computer science or statistics. Female participation is notably high; one teacher even remarked that the course saw more girls enrolled than any of his other computer science classes.
In DSAIY, students experience the full machine learning pipeline from data collection and data preparation, to modeling and deployment. Using Python, they train and test simple machine learning models on authentic healthcare data. The aim of the programme is to move students from basic graphing to evaluating complex models, transitioning them from merely plotting data to deeply reasoning about it.
The programme makes use of CODAP (the Common Online Data Analysis Platform), a free, web-based tool developed by The Concord Consortium. CODAP provides an interactive, highly visual environment that lowers the barrier to entry. Students can visualise large datasets and click into individual data points, allowing them to see individual cases within a larger dataset.
The curriculum uses real-world examples from healthcare to introduce concepts of bias and fairness. For example, students learn about pulse oximeters, which estimate blood oxygen levels. However, as these use red and infrared light, readings can vary depending on skin pigmentation, which can lead to inaccurate readings.
Students also collect their own blood oxygen data and plot it using CODAP to observe variability. They consider the accuracy of their measurements and grapple with the ethics of removing outliers from a dataset. This led to students asking critical questions about the makeup of their datasets, the context in which data are collected, and the implications of how data are used in healthcare.
Through the DSAIY programme, Kathy reported that students developed stronger data reasoning skills, gained a deeper awareness of inherent AI biases and risks, and built confidence in public speaking and collaborating with others. Students were also highly engaged and appreciated the focus on real-world healthcare applications and their social implications.
Kathy concluded the seminar by arguing that AI literacy must start with data literacy. When students learn to examine, question, and reason about the data behind AI technologies, they develop the critical thinking skills needed to engage with outputs from real-world systems or everyday technologies like ChatGPT. This can then help them evaluate both the trustworthiness of these tools and their role in important decision-making processes.
You can watch the seminar here:
If you are interested in learning more about Kathy’s work, you can read about the DSAIY programme here or you can read the paper here. You can also learn about CODAP, the data visualisation tool featured in this seminar here.
In our current seminar series, we’re exploring how AI is taught across the curriculum. In our next seminar on Tuesday 14 July at 17:00–18:30 BST, we welcome Dan Verständig (Goethe University Frankfurt) who will explore the connection between Social explainable AI (Social XAI) and Critical Computational Literacy (CCL). To take part in the seminar, click the button below to register. We hope to see you there.
The schedule of our upcoming seminars is available online. You can catch up on past seminars on our blog and on the previous seminars and recordings page.
The post AI literacy begins with data literacy: An example from healthcare appeared first on Raspberry Pi Foundation.
Measuring student understanding in computing education is not an easy task. As AI literacy becomes an important pillar in computing education, defining and accurately measuring students’ understanding of concepts and their skills is an even greater challenge.
In a recent seminar in our series on teaching about AI and data science, researcher Jesús Moreno-León (Universidad de Sevilla) talked about his work in developing assessment tools for computational thinking (CT) and AI literacy. Jesús is also co-founder of Programamos, a non-profit organisation that promotes the development of computational thinking, supporting teachers through training and sharing resources.
Jesús began by discussing the recent development of computer science assessment tools. Together with Gregorio Robles (Universidad Rey Juan Carlos), they created Dr Scratch, a web-based tool to assess the quality of Scratch projects and detect errors and bad programming habits (e.g. dead code). Projects are scored on the use of computational thinking concepts (e.g. parallelism, conditional logic) and the use of desirable programming practices (e.g. naming sprites, removing duplicate scripts) in order to give feedback to students and teachers to iteratively improve their Scratch projects.
Alongside measuring students’ programming skills, Jesús also shared work by Marcos Román-González (Universidad Nacional de Educación a Distancia) to develop the Computational Thinking test (CTt), a 28-item assessment tool designed to measure the computational thinking skills of students aged 10 to 16 years old. Two collaborators, María Zapata and Estafanía Martín (Universidad Rey Juan Carlos) further adapted these items to create the Beginners Computational Thinking test (or BCTt), an unplugged assessment suitable for younger learners aged 5 to 10 years old.
Jesús also described his more recent work at the Ministry of Education and Vocational Training in Spain to promote computer science at all educational levels. One initiative, La Escuela de Pensamiento Computacional e Inteligencia Artificial (or the School of Computational Thinking and Artificial Intelligence), supported Spanish teachers through training and resources to introduce CT and AI into the classroom. Over 400 teachers and 7000 teachers took part across Spain through unplugged activities and tools such as Machine Learning for Kids and LearningML, allowing students to classify text and images using machine learning. Older students created apps using the MIT App Inventor. When evaluating the design of the curriculum, they found they had strong instruments to measure the development of CT — such as the assessment tools described above — yet nothing to measure AI literacy.
The lack of valid AI literacy assessment tools led the team to develop the AI Knowledge Test (or AIKT), a 14-item survey consisting of multiple-choice questions designed to measure students’ understanding of AI. The instrument was inspired by previous work in the field and relevant research (e.g. the AI4K12 framework).
An example of one of these items is presented below. Can you solve it? The answer is at the bottom of this article.
Q1. Which of the following strategies would be most appropriate for teaching a computer to recognise photos of apples?
In a study on the impact of programming activities on computational thinking and AI literacy in Spanish schools, the authors tested these knowledge-based items with over 2000 students to assess the reliability (e.g. internal consistency), or a measure of the quality of a survey or test. They found one item (“As a user, the legal regulation that is approved regarding AI systems will affect my life”) did not correlate with the other items. This left a total of 13 items which were found to have sufficient internal consistency — meaning how well each item correlated with one another to measure an underlying construct (i.e. “AI knowledge”). They concluded that the assessment tool needed a higher ceiling and needed to address common misconceptions. The authors also learned that teachers needed free and open-source tools with low barriers for entry, such as not needing registration, and were suitable for classroom use, such as limiting data sent to the cloud.
With the rise of generative AI tools like ChatGPT or Google’s Gemini, Jesús and his colleagues felt their AI literacy assessment tool needed to focus on the capabilities of generative AI tools. They also felt they needed to take a broader view of AI and focus on additional dimensions, such as the social and ethical implications of AI tools. They are, therefore, currently revising their assessment items to align with several common frameworks, including the SEAME framework and AI Learning Priorities for All K–12 Students.
One of the revised items is presented below. Can you solve it? The answer is revealed below.
Q2. You have asked your students to design a decision tree to classify different fruits based on three characteristics: color, size, and shape. To check whether the following proposed solution is correct, you are going to test it. As what fruit does the decision tree classify a small, round, yellow apple?
Jesús concluded the seminar by describing his intentions to collaborate with others to test the revised AI literacy instrument with students in early 2026. We look forward to hearing about their results!
You can watch Jesús’s whole seminar here:
If you are interested to learn more about Jesús and his work, you can read about his development of the AI Knowledge Test (or AIKT) here and the Computational Thinking test (CTt) here or look at the original items here. You can also learn about the Beginners Computational Thinking test (BCTt) by watching a Raspberry Pi research seminar about it or reading about it here.
In our current seminar series, we’re exploring applied AI and how AI can be taught across the curriculum. In our next seminar in this series on 17 March at 17.00 UK time, we welcome Rebecca Fiebrink (University of the Arts London) who will explore the questions of how and why we might teach AI for creative practitioners, including children, students, and professionals.
To take part in the seminar, click the button below to register. We hope to see you there.
The schedule of our upcoming seminars is available online. You can catch up on past seminars on our blog and on the previous seminars and recordings page.
The post The challenges of measuring AI literacy appeared first on Raspberry Pi Foundation.
At the end of last year, Professor Becky Francis published her long-awaited Curriculum and Assessment Review for England, accompanied by the UK government’s official response. Buried within that response — and not actually proposed in the Review itself — was a notable commitment: to “explore introducing a new Level 3 qualification* in data science and AI, to ensure that more young people can secure high-value skills for the future and that we cement the UK’s position as a global leader in AI and technology.”
This announcement reflects a growing global recognition that young people need more than basic digital literacy — they need a deeper understanding of data, automation, and the rapidly evolving capabilities of AI. Countries around the world, from Singapore to the United States, are already wrestling with how to embed AI education into secondary schooling. England now joins that international conversation.
AI is an everyday technology now. Young people interact with AI systems constantly, often without realising it. Whether they pursue careers in medicine, engineering, the creative industries, or public policy, they will need a foundational understanding of how AI systems work, what their limitations are, and the ethical implications around them.
Yet in England — and in many education systems globally — very few students receive formal teaching about AI. The English national curriculum makes no explicit reference to AI, and specifications for exams taken at the end of high school include only scattered mentions. This gap leaves young people navigating one of the most transformative technologies of their generation with limited guidance.
In 2025, we joined forces with Professor Lord Lionel Tarassenko, one of the UK’s foremost researchers in AI and machine learning, and Simon Peyton Jones, a world-renowned computer scientist and long-time champion of computing education. Together with teachers, school leaders, universities, industry specialists, and exam boards, we have been exploring how we might begin to close the emerging gap in AI and data science education for 16- to 18-year-olds.
Over the past eight months, this collaboration has allowed us to refine our shared thinking and gather insights from a wide network of experts and practitioners. We are delighted that England’s Department for Education has recognised the potential of this work by appointing us to draft the subject content for a possible new qualification in Data Science and AI.
We are delighted that England’s Department for Education has recognised the potential of [the work we’ve been doing] by appointing us to draft the subject content for a possible new qualification in Data Science and AI.
Designing a qualification of this kind raises important questions — not just for the UK, but for any country considering a similar path.
A meaningful qualification must go beyond the use of tools. It should help students understand data literacy, model behaviour, bias, ethics, and the societal implications of AI. Balancing technical understanding with critical thinking is challenging but essential.
AI should not become the preserve of already-advantaged students. Any qualification must be designed with equity in mind, recognising differences in school capacity, teacher expertise, and students’ prior experience.
Teacher professional development is a major challenge worldwide. Delivering a qualification in AI will require confidence with concepts that are not yet common in teacher training. Sustainable delivery models — supported by high-quality resources and professional development — will be crucial.
There is an active debate about whether the best route for students in England is a high-stakes qualification or a supplementary course that broadens a core programme of study:
Different countries will make different choices based on their systems, but the underlying questions are the same: how do we create something rigorous, scalable, and future-proof?
In October, the Foundation hosted a workshop with representatives from schools, industry, universities, exam boards, and the Department for Education. Together, we explored key questions including:
The feedback we received has been invaluable and will continue to shape the next stage of development. We believe the UK has a significant opportunity to contribute meaningfully to the global conversation about AI education. You can read the latest version of our discussion paper here.
Although the current proposal focuses on England, the underlying challenge is international: how do we prepare young people everywhere to engage thoughtfully and confidently with AI?
We would love to hear from educators, researchers, and policymakers across the world:
To share your ideas or feedback, please get in touch. We’d be delighted to learn from your experience as this important work progresses.
* Level 3 in England is the stage of learning for 16- to 19-year-olds, typically ending in qualifications that pave the way for higher study or advanced apprenticeships.
The post A new qualification in data science and AI for students in England? appeared first on Raspberry Pi Foundation.
In Germany, as in many countries, AI topics are rapidly entering formal computer science education. Yet, this haste often risks us focusing on fleeting technological developments rather than fundamental concepts. As computer science educator Viktoriya Olari, from Free University of Berlin, discovered in her research, the fundamental role of data, which powers most modern AI systems, is critically underestimated in many existing frameworks. If students are to become responsible designers of such systems, they can’t afford to treat AI as an opaque box. Rather, they must first master the messy, human process that begins with the data itself.
In our October research seminar, Viktoriya shared the results of her work over the last four years on how schools can shift the focus from the latest technologies to the underlying data. Her research offers a clear structure for what young people should learn about data and how teachers can make it work inside ordinary classrooms.
Viktoriya’s analysis of existing AI education frameworks found the data domain is underrepresented, with essentials such as data cleaning often not addressed at all. She argues that, because modern AI systems are data driven, students need both language and routines for working with data: being able to name concepts like training vs test data, data quality, and bias, and to explain practices such as collection, cleaning, and pre-processing. That’s the rationale for teaching data concepts and practices first, and then placing modelling inside an explicit, staged lifecycle.

Her talk presented this argument in the German school context, where AI topics are entering state curricula quickly. Her critique targets how existing frameworks fail to address data and how that gap undermines responsible evaluation and design. The proposed model centres data by pairing an eight-stage, data-driven lifecycle with a curated set of key concepts and practices, and by making “data-based judgment skills” a key outcome.
Viktoriya’s work organises this understanding into two foundational components: data concepts (the vocabulary, e.g. training/test data, data quality, overfitting) and data practices (the actions, e.g. collect, clean, train, evaluate).
Viktoriya’s framework is built around an eight-stage data lifecycle, stretching from defining a task through gathering, preparing, modeling, evaluating, and finally sharing or archiving results. Inside that backbone she has identified two layers of learning targets:
More details are available in her work on data-related concepts and practice.
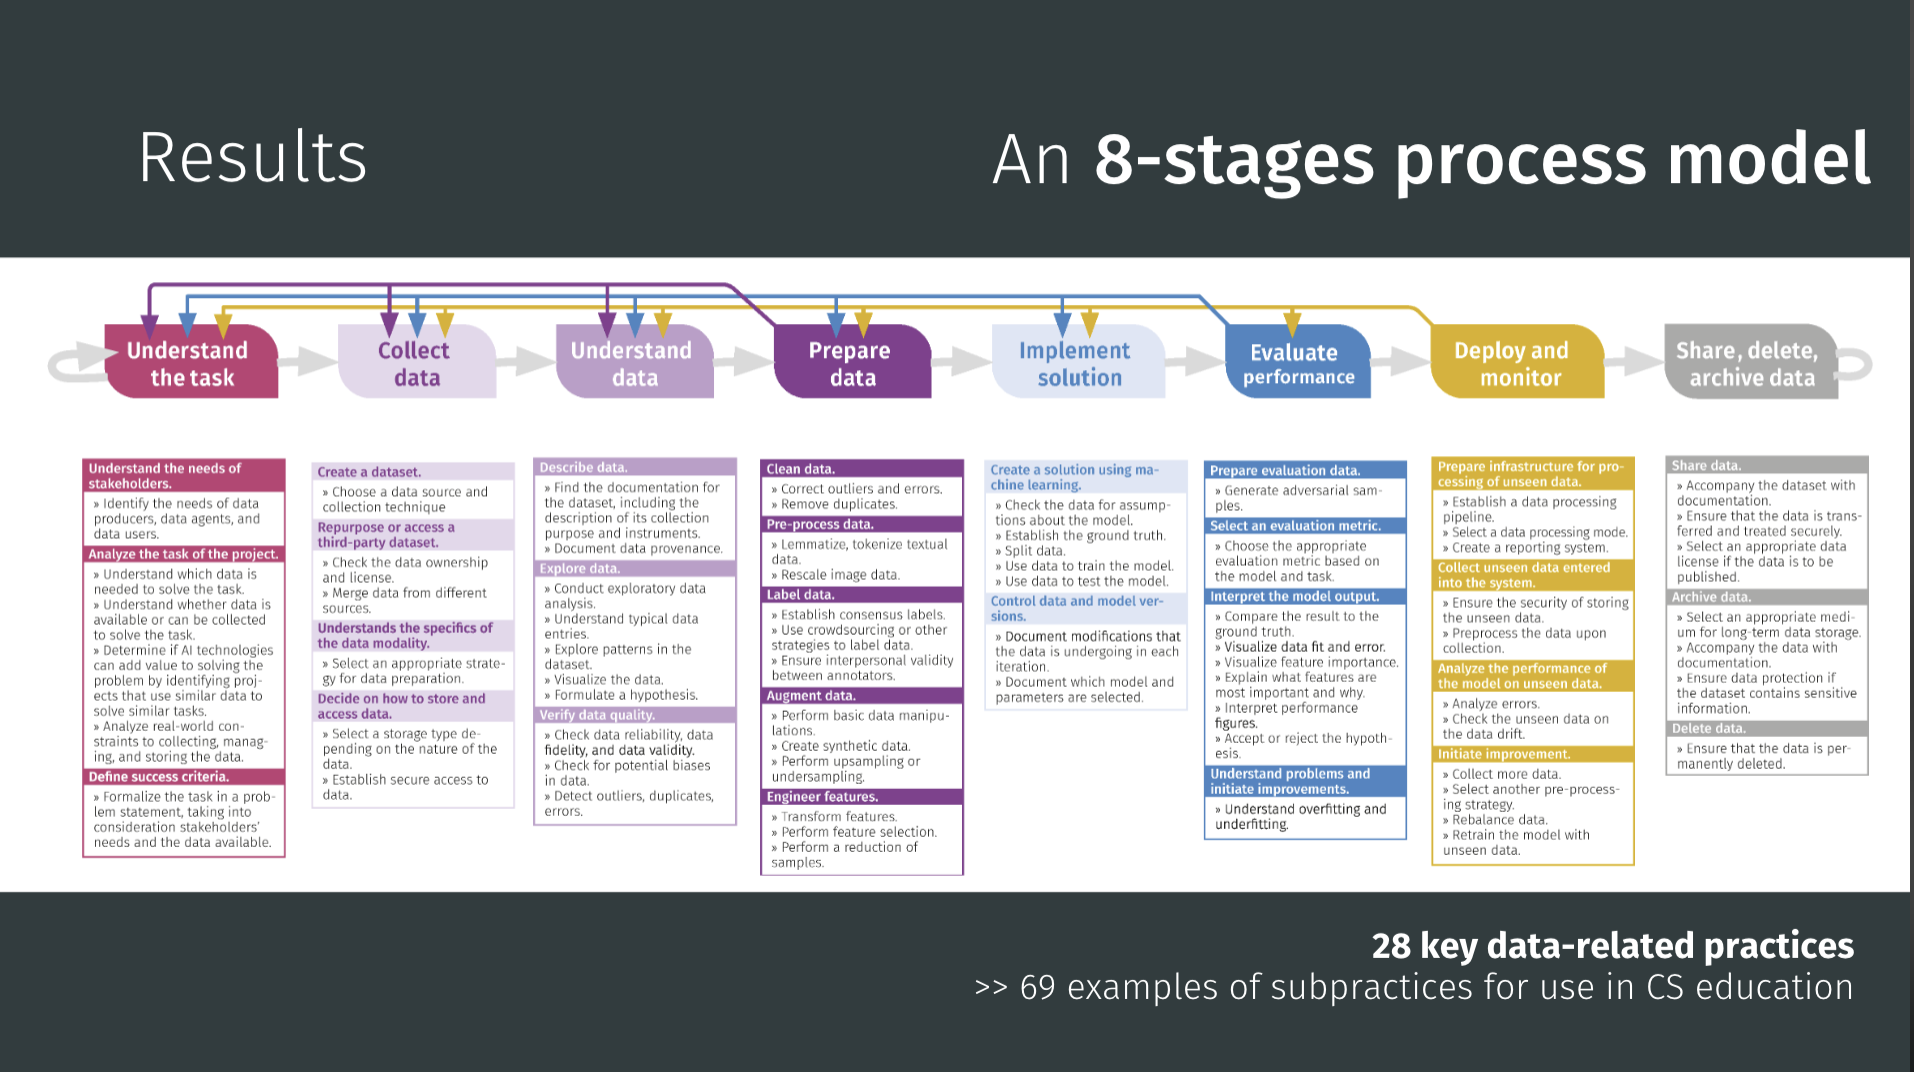
Viktoriya’s 8-stage process model of the data-driven lifecycle. It serves as a guide for curriculum developers and teachers, outlining 28 key data-related practices and providing 69 examples of subpractices for use in K–12 computer science education.
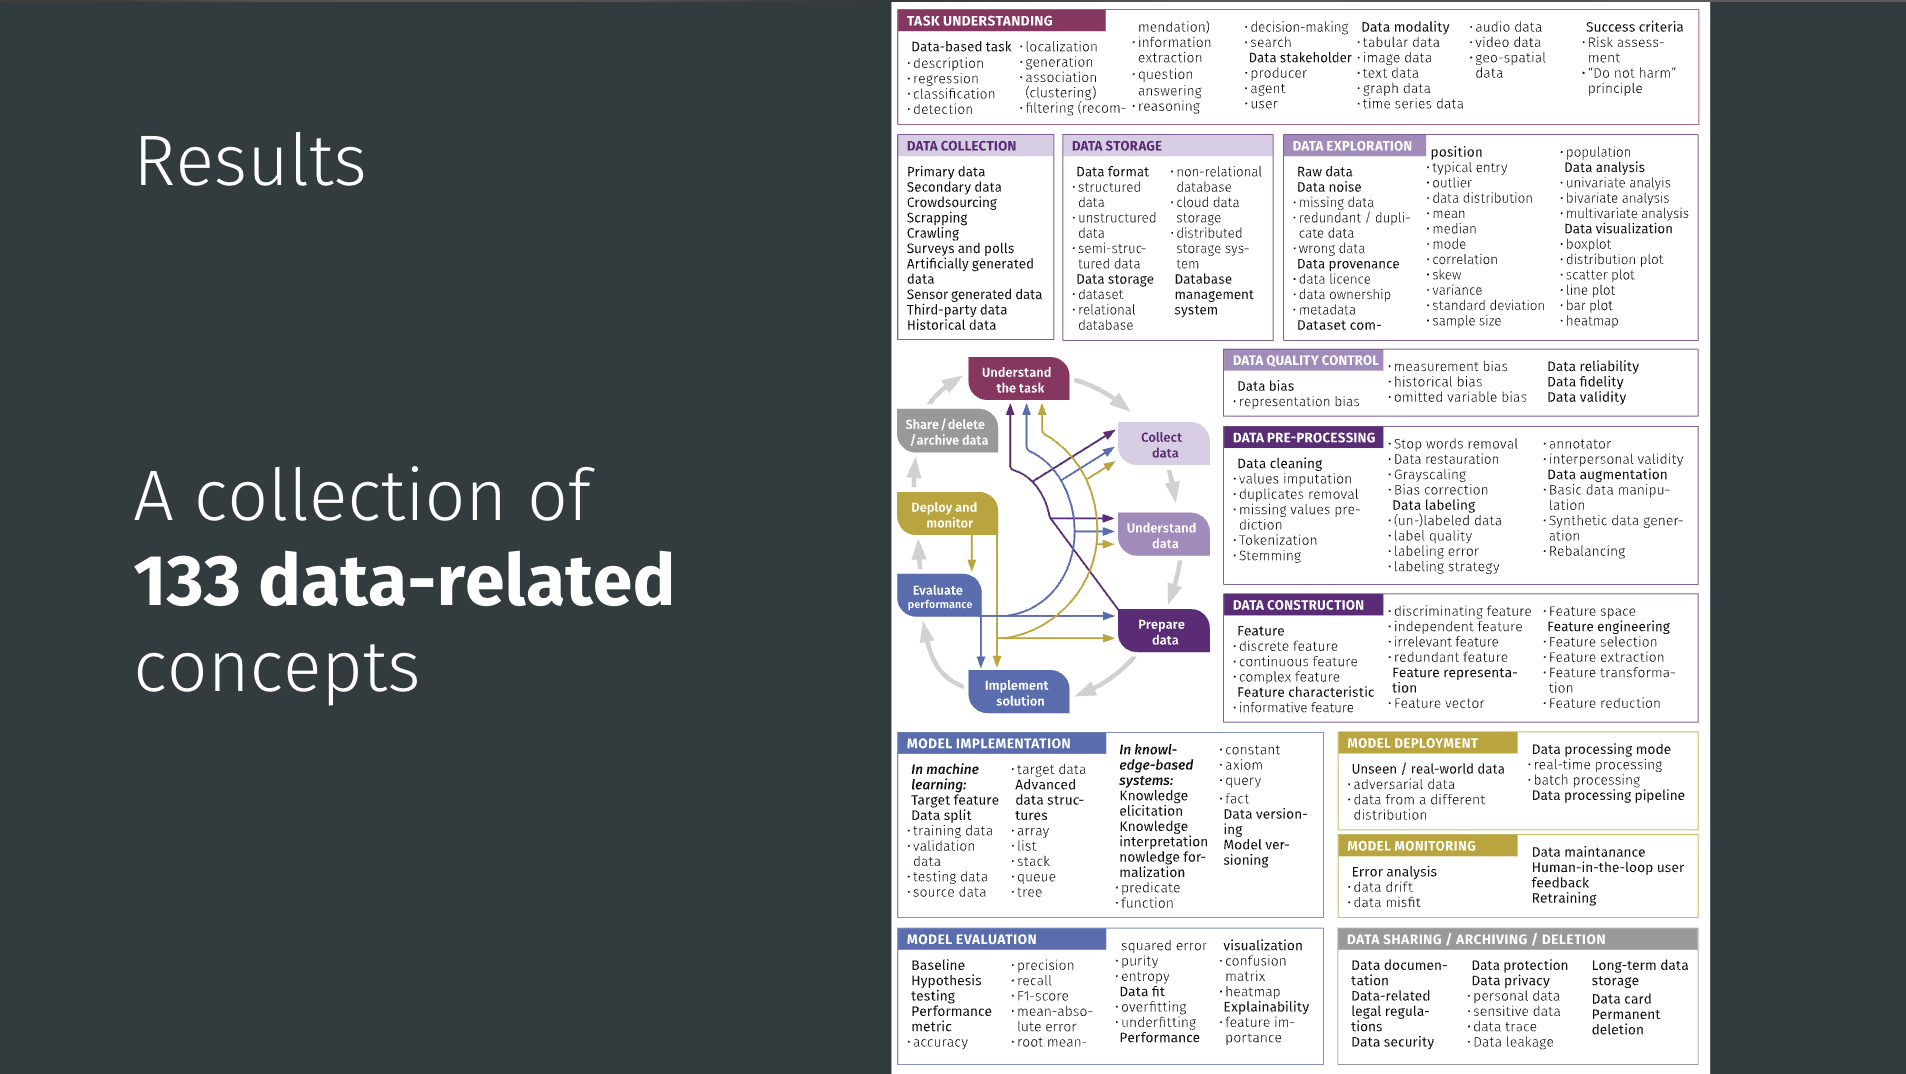
A collection of 133 key data-related concepts. These concepts are organised according to the eight stages of the data-driven lifecycle and provide the foundational vocabulary for teaching AI education.
Viktoriya’s team set out to redesign the format so that real data work could happen within ordinary lessons. They ended up with three “Data Case Study” architectures, each using authentic datasets and domain questions. The materials are supported by Orange 3, an unplugged machine learning and data visualisations tool familiar to the teachers participating. Variants emerged across three design cycles to address specific challenges, but teachers choose among them based on learning objectives and class context.
The data case study method uses real-world data and context to help students achieve three key learning outcomes: go through the data-driven lifecycle, reflect on data practices and concepts in a criteria-guided manner, and develop data-based problem-solving and judgment skills.
Viktoriya’s team ran three design cycles with small groups in Germany, with students aged 14 to 15. Each cycle lasted around 48 hours of teaching. Because participating teachers already knew Orange 3, the emphasis was on pedagogy rather than software training.
The projects drew on manageable real-world data: spreadsheets, time-series sets, a few geographical samples. Two examples are:
Some groups experimented with collecting their own sensor data, a plan that occasionally failed when the hardware didn’t cooperate. However, even that became part of the lesson: reliability, risk, and missing data are real features of data science, not mistakes to hide.
Student work reflected the three architectures. In the bottom-up groups, guided builds produced complete workflows and concise reflections, while top-down groups submitted annotated screenshots and critiques, and the puzzle-based lessons ended with posters and verbal presentations. Across them all, assessment focused on reasoning: not whether the “right” model appeared, but whether students could explain the stage they were in and justify their choices.
Everything Viktoriya described is open and classroom-ready (currently in German). The computingeducation.de/proj-datacases hub hosts teacher guides, student tasks, and sample Orange 3 files. The growing library of data cases covers topics from climate data to air quality analytics.
In the UK, a curriculum review has been recently released and along with the Government’s response. Across Europe and beyond, education systems are racing to add AI content to their curricula. Tools will come and go, and benchmarks will keep moving. What endures is the capacity to reason about data: to know what stage of work you’re in, what evidence supports your decisions, and what trade-offs you’re making. That is why Viktoriya’s contribution is unique — it gives teachers a map, a shared vocabulary, and practical ways to make data visible and the focus of discussion in schools.
You can read this blog to see how we’ve used Viktoriya’s framework in our work designing a data science curriculum for schools.
Join us at our seminar on Tuesday 27 January from 17:00 to 18:30 GMT to hear Salomey Afua Addo talk about how to teach about neural networks in Junior High Schools in Ghana.
To sign up and take part, click the button below. We’ll then send you information about joining.
We hope to see you there. This will be the final seminar in our series on teaching about AI and data science — the next series focuses on how to teach about applied AI across subjects and disciplines.
You can view the schedule of our upcoming seminars, and catch up on past seminars on our previous seminars page.
WKS2 teachers, participate in our new study!
We’re launching a new study to explore how to teach learners aged 9 to 11 about data-driven computing. The study will take place in collaboration with KS2 teachers (Y4/Y5/Y6) in England, Scotland and Wales and look at:
Our goal is to find practical ways to help teachers build children’s confidence in working with data in computing lessons. The study will be collaborative, with two workshops held throughout 2026, and we’re inviting KS2 teachers (Y4/Y5/Y6) to take part.
You can express your interest in participating by filling in this form: rpf.io/data-science-study-blog
The post How to put data first in K–12 AI education by using data case studies appeared first on Raspberry Pi Foundation.
For the last five years, once a month, we have hosted an online seminar sharing computing education research. Seminars are organised as usually year-long series with changing themes. In 2025, for example, our theme was ‘Teaching about AI and data science’. In 2024, it was ‘Teaching programming (with or without AI)’.
It is not surprising that for the last few years our focus has been on AI technology, and for 2026 we will continue this. But we will shift from showcasing how computing education research is changing teaching and learning in computing lessons, to showcasing how computing education research in other disciplines, such as art or geography, is starting to include teaching about AI. For example, art lessons may change so that learners find out how professional artists are using AI tools to create arts. Or geography lessons may change so that learners discover how professional geographers are using AI to make predictions about physical or human aspects of geography, such as volcanic activity and global warming.
Our series for 2026 is called ‘Applied AI’. This title recognises that AI technology is applied across contexts, across careers, across disciplines, and this means what we teach across school subjects will change.
The majority of resources and professional development material related to teaching about AI have been developed by the computer science community. For example, we have developed the popular Experience AI resources in collaboration with Google DeepMind. In these resources, the contexts were carefully selected to represent real-world examples across disciplines, and to to enable the teaching of particular technical or social and ethical concepts. This could be described as “a push” of content from computing towards other disciplines. For example, to enable teaching about the ethical issues around plagiarism, an art context is used in the Experience AI resources; to enable teaching about the potential benefits of using AI tools, an ecological geography context is used.
AI applications are always situated within a particular topic. Most current AI applications are data-driven: vast amounts of data are collected and processed to produce models that can then either be used to generate outputs or make predictions. For example, data about artworks can be collected and used to train a model for generating outputs similar to the artworks; this is an application of AI in the art discipline. Or data on wild fires can be collected and used to train a model for making predictions about current or prospective fires; this is an application of AI in the geography discipline.
In reality, the best people to recognise how AI technology is being applied in a discipline and what students in that discipline should be taught about these applications are the people working in the discipline, for example the art and geography teachers. Computer science educators can work to build the technical understanding and the general social and ethical understanding that is common across applications. But the detail of how AI technology is changing a discipline can only truly be understood by the respective community, by the artists and art educators, by the geographers and the geography educators.
At present, though, most educators are grappling with how they can use AI tools for productivity, such as creating lesson plans, or answering emails. Or they are looking at how they can use AI for general teaching and learning, for example for personalisation, say for students with additional needs. The idea that their underpinning discipline is changing is, perhaps, not yet on teachers’ radar. But at universities, such as in undergraduate courses, and in the world of work, education and training are changing. Data science courses are now being offered across faculties, including science, geography, language, and art faculties. These changes will start to filter down to school-based education via curriculum change. While some resources and professional development materials addressing this shift are already becoming available, change is still fragile and patchy.
The aims of our Applied AI research seminar series in 2026 are to start to:
If we can start to agree on what common concepts could be taught in the arts, sciences and humanities, it gives us a better chance to:
To make our 2026 series a success, we need to spread the word about our seminars to groups of educators, researchers, industry and policy makers across the arts, sciences, and humanities.
Please tell those you know in these groups about the seminar series, and share it through your social media and other networks. If you have ideas for subject associations we could connect with or publications where we can write about our series, please let us know.
We have already arranged the following seminars across 2026 and will add more speakers for the remaining monthly slots soon. Seminars always take place online on Tuesdays at 17:00 to 18:30 UK time.
To sign up and take part, click the button below. We’ll then send you information about joining. We hope to see you there.
You can view the schedule and details of our upcoming seminars on this page, and catch up on past seminars on our previous seminars page.
PS If you are teaching upper primary school learners in England, you can currently register your interest in our upcoming collaborative study on data science education. You’ll find out more about some of the research we’ve done in this area in this blog post.
The post How can we teach about AI in the arts, humanities and sciences? Research seminar series 2026 appeared first on Raspberry Pi Foundation.
Research indicates that teaching learners to use and create with data-driven technologies such as AI and machine learning (ML) requires an entirely different approach for solving problems compared to traditional programming activities.
In this blog, we share the new data paradigms framework that we have developed through research and used to help improve our understanding about how to teach and learn about AI and data science. We also invite you to register your interest in participating in our next collaborative study on the topic.
Let’s start by highlighting an important distinction between different approaches to designing systems. In a knowledge-based approach to system design, a set of rules (e.g., if-then statements) are written for the system to execute. Every rule is explicitly defined. This approach is called ‘rule-based’, ‘symbolic’, or ‘logic-based’. For example, a developer could create a program that simulates dialogue by writing specific lines of code to handle a greeting, such as “IF user says “Hello” THEN output “Hi!”. If the user types “Greetings!” instead, the program fails because it has no rule for that specific word.
Knowledge-based models are often said to be explainable by design. This means the logic is accessible and interpretable and developers can trace the exact steps taken to produce an output. For example, if developers manually classify restaurant reviews as positive or negative using a pre-defined set of criteria, the rules their restaurant classifying system follows are entirely explicit, and the path from input to output is clear and explainable.
By contrast, in a data-driven approach to system design developers do not write specific rules. Instead, they collect lots of data and train a model. In the dialogue simulator example, they would collect hundreds of examples of greetings and train a model to the pattern of a greeting. If the user types “Greetings!”, the system generates a response based on the patterns in its training data.
Data-driven models are often opaque. In other words, the internal workings of these ML models are hidden. While we can see our input and the system’s output, the internal mathematical process is so complex — often involving layers of calculations and abstractions — that we cannot simply “explain” why a specific output was produced. For example, developers can create a classification model by training a neural network using thousands of images. Due to the large quantity of data used to train the model, and complex internal parameters and hidden layers, developers and users of the system cannot understand or explain the logic or features that lead to a specific output. These kinds of models are often referred to as a “black box” (as opposed to a “glass” or “clear” box).
Researchers have argued that the move from knowledge-based (or rule-based) programming to data-driven system design represents a paradigm shift and creates unique challenges for educators. The challenge is helping students shift from the expectation that a system produces a single ‘right’ answer — characteristic of traditional rule-based programming — toward an understanding that systems trained on large quantities of data produce outcomes that aren’t always fixed or explainable. If the current instruction in the classroom still relies heavily on traditional rule-based programming approaches, we might be setting students up for misconceptions.
In our research work on AI and data science at the Raspberry Pi Computing Education Research Centre, we analysed 84 research studies about the teaching and learning of data science. We categorised learning activities used in the studies to understand whether they were (i) knowledge-based or data-driven, and (ii) the extent to which the underlying models used were transparent or opaque. This led us to define four distinct data paradigms:
The data paradigms framework helps us to distinguish between different kinds of modeling activities students take part in and how instructional approaches could be classified across one or more paradigms. For instance, we found that most data-driven activities were also opaque (DD + O), usually meaning that students collected and used data to train a model, but how the system worked was opaque. This pattern, where the data is visible but the model is not explainable, risks students forming misconceptions about the capabilities and limitations of data-driven systems. Without understanding how outputs are generated, students may expect data-driven ML systems to operate like fully explainable (or transparent) ones.
We think that lessons are needed in the data-driven opaque (DD + O) quadrant to explicitly teach students about how data-driven systems work and the role they play in everyday contexts. However, when teaching data-driven opaque (DD + O) activities, learners’ attention needs to be directed to concepts such as model confidence, data quality, and model evaluation. Since an ML model is not inherently explainable, we need to teach students to use post-hoc explanation methods, such as testing different inputs to see how a system’s output changes. To prepare students for this learning experience, we think that first introducing activities about rule-based systems (knowledge-based + transparent; KB + T) or simple data exploration, such as linear regression or data visualisation (data-driven + transparent; DD + T) may serve as a ‘bridge’ to understanding data-driven modeling by helping students to distinguish between systems built from specific logical rules and systems trained on data.
We believe the idea of data paradigms can serve as a way of framing teaching activities about data science and help educators and students to consider the transition between different paradigms when engaging with the systems we interact with every day.
KS2 teachers, participate in our new study!
We’re launching a new study to explore how to teach learners aged 9 to 11 about data-driven computing. The study will take place in collaboration with KS2 teachers (Y4/Y5/Y6) in England, Scotland and Wales and look at:
Our goal is to find practical ways to help teachers build children’s confidence in working with data in computing lessons. The study will be collaborative, with two workshops held throughout 2026, and we’re inviting KS2 teachers (Y4/Y5/Y6) to take part.
You can express your interest in participating by filling in this form:
The post A research-led framework for teaching about models in AI and data science appeared first on Raspberry Pi Foundation.
Current artificial intelligence (AI) methods, especially machine learning (ML), rely heavily on data. To complement our work on AI literacy, we have been investigating what data science teaching resources and education research are currently available. Our goal is to work out what data science concepts should be taught in a data science curriculum for schools.
Read on to find out what resources and materials we have reviewed, and what concept themes we have identified.
Data science is an interdisciplinary science of learning from large datasets, aided by modern computational tools and methods (Ow‑Yeong et al., 2023). We see data science skills as fundamental for using, creating, and thinking critically about:
To navigate a world where decision making in many areas is influenced by data-driven insights and predictions, young people need to be taught about data science. Data science skills empower young people to become critical thinkers, discerning consumers, adaptable professionals, and informed citizens.
Worldwide, countries are taking a variety of approaches to introducing data science into their education systems, as highlighted in a 2024 report from the coalition Data Science 4 Everyone.

In some countries, such as India and Israel, data science education is an established school subject. It is taught as part of the curriculum in at least one of the primary, secondary, or post-16 age phases. Meanwhile in other countries, for example Canada, Germany, and Poland, data science is a very new school subject, or there are still only recommendations to develop it into a school subject.
While we are currently considering what a comprehensive data science curriculum should include, we already offer several resources to support you with your teaching about data science and data-driven technologies. You can find a list of these resources at the end of this blog. Now, however, I’ll give you an overview of our recent work to identify concepts for a data science curriculum that fits with our approach to AI literacy.
To answer the question ‘What should we teach about data science to learners aged 5 to 19?’, we undertook a grey literature review of data science teaching materials. A grey literature review is structured like an academic literature review and conducted with the same rigour. The difference is that a grey literature review also considers publications that have not been peer-reviewed, including reports, white papers, curriculum materials, and similar resources.
To orient our work, we combined four frameworks for data science and AI/ML education:
With these combined frameworks as our map, we reviewed 79 data science learning resources. The resources varied:
From among the 79 resources, we chose 9 that included clear learning outcomes, and that together covered a wide field of concepts. We examined these 9 in detail to extract 181 explicit and implicit data science concepts. Next, we grouped the concepts into themes, and finally we refined these themes by comparing them against the four frameworks listed above.
The themes we have identified for a data science curriculum are:
This set of themes both fits with the frameworks by Olari and Romeike and Data Science 4 Everyone, and expands them by covering ML principles and programming approaches and calling out data bias and ethics.
Through our grey literature review on data science education, we’ve:
Our next step is to shape these candidate concepts into a progression framework to describe their relationships and establish which concepts could be taught at each age or phase of schooling.
The literature review also gave us an overview of the pedagogical approaches and tools used for teaching data science concepts. These findings will become useful once we start designing learning activities.
You’ll hear more about how this work is going here on our blog and on our social channels. In the meantime, comment below to let us know what you think about the themes, or to tell us what you’d like to see in a data science curriculum for the learners you work with.
You can read about our thinking behind the data science-related teaching resources we’ve created so far in our ‘Data and information within the computing curriculum’ report from 2019.
You might also be interested in exploring the Experience AI programme, which offers everything teachers need to help students develop a foundational understanding of data-driven AI technologies, their social and ethical implications, and the role that AI can play in their lives.
Our free online course ‘Teach teens computing: Machine learning and AI‘ helps teachers understand and explain the types of problems that ML can help to solve, discuss how AI is changing the world, and think about the ethics of collecting data to train a ML model.
Teaching young people to understand data-driven AI technologies means teaching them thinking skills that are different to those needed to understand rule-based computer systems. You can read about these Computational Thinking 2.0 skills in our Quick Read PDF.
Our current research seminar series focuses on teaching about AI and data science. Sign up for an upcoming seminar session (the next one is on 11 November) or catch up on past sessions to find out what the latest research findings are in this area. You can also revisit our 2021/22 series on the same topic to see how work in this area has developed. The Raspberry Pi Computing Education Research Centre also has ongoing projects in the area of AI education for you to explore.
The post What should be included in a data science curriculum for schools? appeared first on Raspberry Pi Foundation.
As data and data-driven technologies become a bigger part of everyday life, it’s more important than ever to make sure that young people are given the chance to learn data science concepts and skills.
In our April research seminar, David Weintrop, Rotem Israel-Fishelson, and Peter Moon from the University of Maryland introduced API Can Code, a data science curriculum designed with high school students for high school students. Their talk explored how their innovative work uses real-world data and students’ own experiences and interests to create meaningful, authentic learning experiences in data science.
Quick note for educators: Are you interested in joining our free, exploratory data science education workshop for teachers on 10 July 2025 in Cambridge, UK? Then find out the details here.
David started by explaining the motivation behind the API Can Code project. The team’s goal was not to turn students into future data scientists, but to offer students the data literacy they need to explore and critically engage with a data-driven world.
The work was also guided by a shared view among leading teachers’ organisations that data science should be taught across all subjects in the K–12 curriculum. It also draws on strong research showing that when educational experiences connect with students’ own lives and interests, it leads to deeper engagement and better learning outcomes.
To prepare for the design of the curriculum, David, Rotem, and Peter wanted to understand what data science education options already exist for K–12 students. Rotem described how they compared four major K–12 data science curricula and examined different aspects, such as the topics they covered and the datasets they used. Their findings showed that many datasets were quite small in size, and that the datasets used were not always about topics that students were interested in.
The team also looked at 30 data science tools used across different K–12 platforms and analysed what each could do. They found that tools varied in how effective they were and that many lacked accessibility features to support students with diverse learning needs.
This analysis helped to refine the team’s objective: to create a data science curriculum that students find interesting and that is informed by their values and voices.
To work towards this goal, the team used a methodology called participatory design. This is an approach that actively involves the end users — in this case, high school students — in the design process. During several in-person sessions with 28 students aged 15 to 18 years old, the researchers facilitated low-tech, hands-on activities exploring the students’ identities and interests and how they think about data.
One activity, Empathy Map, involved students working together to create a persona representing a student in their school. They were asked to describe the persona’s daily life, interests, and concerns about technology and data:
The students’ involvement in the design process gave the team a better understanding of young people’s views and interests, which helped create the design of the API Can Code curriculum.
Peter provided an overview of the API Can Code curriculum. It follows a three-unit flow covering different concepts and tools in each unit:
Peter described an example activity carried out by the students, showing how these three units flow together and build both technical skills and an understanding of the real-world uses of data science. Students were tasked with analysing a dataset from Zillow, a property website, to explore the question “How much does a house in my neighbourhood cost?” The images below show the process the students followed, which uses the data science skills and tools from all three units of the curriculum.
A central tenet of API Can Code is that students should explore data that matters to them. A diverse range of student interests was identified during the design work, and the curriculum uses these areas of interest, such as music, movies, sports, and animals, throughout the lessons.
The curriculum also features an open-ended final project, where students can choose a research question that is important to them and their lives, and answer it using data science skills.
The team shared two examples of memorable final projects. In one, a student set out to answer the question “Is Jhené Aiko a star?” The student found a publicly available dataset through an API provided by Deezer, a music streaming platform. She wrote a program that retrieved data on the artist’s longevity and collaborations, analysed the data, and concluded that Aiko is indeed a star. What stood out about this project wasn’t just the fact that the student independently defined stardom and answered their research question using real data, but that this was a truly personal, interest-driven project. David noted that the researchers could never have come up with this activity, since they had never previously heard of Jhené Aiko!
Another student’s project analysed data about housing in Washington DC to answer the question “Which ward in DC has the most affordable houses?” Rotem explained that this student was motivated by her family thinking about moving away from the city. She wanted to use her project to persuade her parents to stay by identifying the most affordable ward in DC that they could move to. She was excited by the outcome of her project, and she presented her findings to other students and her parents.
These projects underscore the power of personally important data science projects driven by students’ interests. When students care about the questions they are exploring, they’re more invested in the process and more likely to keep using the skills and concepts they learn.
API Can Code is available online and completely free to use. Teachers can access lesson plans, tutorial videos, assessment rubrics, and more from the curriculum’s website https://apicancode.umd.edu/. The site also provides resources to support students, including example programs and glossaries.
In our current seminar series, we’re exploring teaching about AI and data science. Join us at our next seminar on Tuesday, 17 June from 17:00 to 18:30 BST to hear Netta Iivari (University of Oulu) introduce transformative agency and its importance for children’s computing education in the age of AI.
To sign up and take part in our research seminars, click below:
You can also view the schedule of our upcoming seminars, and catch up on past seminars on our previous seminars and recordings page.
The post Bringing data science to life for K–12 students with the ‘API Can Code’ curriculum appeared first on Raspberry Pi Foundation.
Are you a teacher who is interested in data science education for key stage 5 (age 16 to 18)? Then we invite you to join our free, in-person workshop exploring the topic, taking place in Cambridge, UK on 10 July 2025.
You will be among the very first educators to see some of our first test activities for teacher training to build data science concepts, and your contributions will feed into our future work. Sign up by 20 June to take part.
Current artificial intelligence (AI) methods, especially machine learning (ML), rely heavily on data. While young people learn mathematics, and some statistics, at school, data science concepts are not commonly taught.
To complement our work on AI literacy, we have been investigating what data science teaching resources and education research are currently available.
Our goals for this work are:
If you are interested in data science education for young people, and maybe even have experience of teaching it to learners aged 16 to 18 in your school (in any subject, including computer science, social sciences, mathematics, statistics, and ethics), please join our free workshop on Thursday 10 July in our office in Cambridge. We are able to reimburse some travel expenses.
At the workshop:
You’ll be the first group of working teachers we will share these activities with — your feedback will be invaluable, and you’ll have the chance to shape our work going forward.
If you are interested, please fill in this form by Friday 20 June:
You will then receive more information from us by 27 June. Spaces in the workshop are limited, so please do not book any travel until we confirm your space.
We’re looking forward to shaping the future of data science education with you.
PS In our current seminar series, researchers from around the world are presenting their latest work on teaching about AI and data science. You can catch up on past sessions and sign up for upcoming ones on our website.
The post Join our free data science education workshop for teachers appeared first on Raspberry Pi Foundation.
As artificial intelligence continues to shape our world, understanding how to teach about AI has never been more important. Our new research seminar series brings together educators and researchers to explore approaches to AI and data science education. In the first seminar, we welcomed Shuchi Grover, Director of AI and Education Research at Looking Glass Ventures. Shuchi began by exploring the theme of teaching using AI, then moved on to discussing teaching about AI in K–12 (primary and secondary) education. She emphasised that it is crucial to teach about AI before using it in the classroom, and this blog post will focus on her insights in this area.
From her research, Shuchi has developed a framework for teaching about AI that is structured as four interlocking components, each representing a key area of understanding:
This framework shows the multifaceted nature of AI literacy, which involves an understanding of both technical aspects and ethical and societal considerations.
Shuchi emphasised the importance of learning about AI ethics, highlighting the topic of bias. There are many ways that bias can be embedded in applications of AI and machine learning, including through the data sets that are used and the design of machine learning models. Shuchi discussed supporting learners to engage with the topic through exploring bias in facial recognition software, sharing activities and resources to use in the classroom that can prompt meaningful discussion, such as this talk by Joy Buolamwini. She also highlighted the Kapor Foundation’s Responsible AI and Tech Justice: A Guide for K–12 Education, which contains questions that educators can use with learners to help them to carefully consider the ethical implications of AI for themselves and for society.
In computer science education, computational thinking is generally associated with traditional rule-based programming — it has often been used to describe the problem-solving approaches and processes associated with writing computer programs following rule-based principles in a structured and logical way. However, with the emergence of machine learning, Shuchi described a need for computational thinking frameworks to be expanded to also encompass data-driven, probabilistic approaches, which are foundational for machine learning. This would support learners’ understanding and ability to work with the models that increasingly influence modern technology.
Shuchi shared that a variety of pedagogies have been used in recent research projects on AI education, ranging from hands-on experiences, such as using APIs for classification, to discussions focusing on ethical aspects. You can find out more about these pedagogies in her award-winning paper Teaching AI to K-12 Learners: Lessons, Issues and Guidance. This plurality of approaches ensures that learners can engage with AI and machine learning in ways that are both accessible and meaningful to them.
Shuchi shared examples of activities from two research projects that she has led:
At the end of her talk, Shuchi shared some final thoughts addressing teaching about AI to K–12 learners:
In our current seminar series, we are exploring teaching about AI and data science. Join us at our next seminar on Tuesday 11 March at 17:00–18:30 GMT to hear Lukas Höper and Carsten Schulte from Paderborn University discuss supporting middle school students to develop their data awareness.
To sign up and take part in the seminar, click the button below — we will then send you information about joining. We hope to see you there.
I want to join the next seminarThe schedule of our upcoming seminars is online. You can catch up on past seminars on our previous seminars and recordings page.
The post Teaching about AI in K–12 education: Thoughts from the USA appeared first on Raspberry Pi Foundation.
AI, machine learning (ML), and data science infuse our daily lives, from the recommendation functionality on music apps to technologies that influence our healthcare, transport, education, defence, and more.
What jobs will be affected by AL, ML, and data science remains to be seen, but it is increasingly clear that students will need to learn something about these topics. There will be new concepts to be taught, new instructional approaches and assessment techniques to be used, new learning activities to be delivered, and we must not neglect the professional development required to help educators master all of this.
As AI and data science are incorporated into school curricula and teaching and learning materials worldwide, we ask: What’s the research basis for these curricula, pedagogy, and resource choices?
In 2024, we showcased researchers who are investigating how AI can be leveraged to support the teaching and learning of programming. But in 2025, we look at what should be taught about AI, ML, and data science in schools and how we should teach this.
We are very excited that we have already secured several key researchers in the field.
On 21 January, Shuchi Grover will kick off the seminar series by giving an important overview of AI in the K–12 landscape, including developing both AI literacy and AI ethics. Shuchi will provide concrete examples and recently developed frameworks to give educators practical insights on the topic.
Our second session will focus on a teacher professional development (PD) programme to support the introduction of AI in Upper Bavarian schools. Franz Jetzinger from the Technical University of Munich will summarise the PD programme and share how teachers implemented the topic in their classroom, including the difficulties they encountered.
Again from Germany, Lukas Höper from Paderborn University, with Carsten Schulte will describe important research on data awareness and introduce a framework that is likely to be key for learning about data-driven technology. The pair will talk about the Data Awareness Framework and how it has been used to help learners explore, evaluate, and be empowered in looking at the role of data in everyday applications.
Our April seminar will see David Weintrop from the University of Maryland introduce, with his colleagues, a data science curriculum called API Can Code, aimed at high-school students. The group will highlight the strategies needed for integrating data science learning within students’ lived experiences and fostering authentic engagement.
Later in the year, Jesús Moreno-Leon from the University of Seville will help us consider the thorny but essential question of how we measure AI literacy. Jesús will present an assessment instrument that has been successfully implemented in several research studies involving thousands of primary and secondary education students across Spain, discussing both its strengths and limitations.
Our seminars are designed to be accessible to anyone interested in the latest research about AI education — whether you’re a teacher, educator, researcher, or simply curious. Each session begins with a presentation from our guest speaker about their latest research findings. We then move into small groups for a short discussion and exchange of ideas before coming back together for a Q&A session with the presenter.
Attendees of our 2024 series told us that they valued that the talks “explore a relevant topic in an informative way“, the “enthusiasm and inspiration”, and particularly the small-group discussions because they “are always filled with interesting and varied ideas and help to spark my own thoughts”.
The seminars usually take place on Zoom on the first Tuesday of each month at 17:00–18:30 GMT / 12:00–13:30 ET / 9:00–10:30 PT / 18:00–19:30 CET.
You can find out more about each seminar and the speakers on our upcoming seminar page. And if you are unable to attend one of our talks, you can watch them from our previous seminar page, where you will also find an archive of all of our previous seminars dating back to 2020.
To attend the seminars, please register here. You will receive an email with the link to join our next Zoom call. Once signed up, you will automatically be notified of upcoming seminars. You can unsubscribe from our seminar notifications at any time.
We hope to see you at a seminar soon!
The post How can we teach students about AI and data science? Join our 2025 seminar series to learn more about the topic appeared first on Raspberry Pi Foundation.
Every day, most of us both consume and create data. For example, we interpret data from weather forecasts to predict our chances of a good weather for a special occasion, and we create data as our carbon footprint leaves a trail of energy consumption information behind us. Data is important in our lives, and countries around the world are expanding their school curricula to teach the knowledge and skills required to work with data, including at primary (K–5) level.
In our most recent research seminar, attendees heard about a research-based initiative called Data Education in Schools. The speakers, Kate Farrell and Professor Judy Robertson from the University of Edinburgh, Scotland, shared how this project aims to empower learners to develop data literacy skills and succeed in a data-driven world.
“Data literacy is the ability to ask questions, collect, analyse, interpret and communicate stories about data.”
– Kate Farrell & Prof. Judy Robertson
Scotland’s national curriculum does not explicitly mention data literacy, but the topic is embedded in many subjects such as Maths, English, Technologies, and Social Studies. Teachers in Scotland, particularly in primary schools, have the flexibility to deliver learning in an interdisciplinary way through project-based learning. Therefore, the team behind Data Education in Schools developed a set of cross-curricular data literacy projects. Educators and education policy makers in other countries who are looking to integrate computing topics with other subjects may also be interested in this approach.
The Data Education in Schools projects are aimed not just at giving learners skills they may need for future jobs, but also at equipping them as data citizens in today’s world. A data citizen can think critically, interpret data, and share insights with others to effect change.
Kate and Judy shared an example of data citizenship from a project they had worked on with a primary school. The learners gathered data about how much plastic waste was being generated in their canteen. They created a data visualisation in the form of a giant graph of types of rubbish on the canteen floor and presented this to their local council.
As a result, the council made changes that reduced the amount of plastic used in the canteen. This shows how data citizens are able to communicate insights from data to influence decisions.
Across its projects, the Data Education in Schools initiative uses a problem-solving cycle called the PPDAC cycle. This cycle is a useful tool for creating educational resources and for teaching, as you can use it to structure resources, and to concentrate on areas to develop learner skills.
The five stages of the cycle are:
Smaller data literacy projects may focus on one or two stages within the cycle so learners can develop specific skills or build on previous learning. A large project usually includes all five stages, and sometimes involves moving backwards — for example, to refine the problem — as well as forwards.
At primary school, the aim of data literacy projects is to give learners an intuitive grasp of what data looks like and how to make sense of graphs and tables. Our speakers gave some great examples of playful approaches to data. This can be helpful because younger learners may benefit from working with tangible objects, e.g. LEGO bricks, which can be sorted by their characteristics. Kate and Judy told us about one learner who collected data about their clothes and drew the results in the form of clothes on a washing line — a great example of how tangible objects also inspire young people’s creativity.
As learners get older, they can begin to work with digital data, including data they collect themselves using physical computing devices such as micro:bit microcontrollers or Raspberry Pi computers.
You can access the seminar slides here.
For many attendees, one of the highlights of the seminar was seeing the range of high-quality teaching resources for learners aged 3–18 that are part of the Data Education in Schools project. These include:
More resources are due to be published later in 2023, including a set of prompt cards to guide learners through the PPDAC cycle, a handbook for teachers to support the teaching of data literacy, and a set of virtual data-themed escape rooms.
You may also be interested in the units of work on data literacy skills that are part of The Computing Curriculum, our complete set of classroom resources to teach computing to 5- to 16-year-olds.
At our next seminar we welcome Aim Unahalekhaka from Tufts University, USA, who will share research about a rubric to evaluate young learners’ ScratchJr projects. If you have a tablet with ScratchJr installed, make sure to have it available to try out some activities. The seminar will take place online on Tuesday 6 June at 17.00 UK time, sign up now to not miss out.
To find out more about connecting research to practice for primary computing education, you can see a list of our upcoming monthly seminars on primary (K–5) teaching and learning and watch the recordings of previous seminars in this series.
The post Introducing data science concepts and skills to primary school learners appeared first on Raspberry Pi Foundation.
For our seminar series on cross-disciplinary computing, it was a delight to host Genevieve Smith-Nunes this September. Her research work involving ballet and augmented reality was a perfect fit for our theme.
Genevieve has a background in classical ballet and was also a computing teacher for several years before starting Ready Salted Code, an educational initiative around data-driven dance. She is now coming to the end of her doctoral studies at the University of Cambridge, in which she focuses on raising awareness of data ethics using ballet and brainwave data as narrative tools, working with student Computing teachers.
You may be surprised that there are links between dance, particularly ballet, and computing. Genevieve explained that classical ballet has a strict repetitive routine, using rule-based choreography and algorithms. Her work on data-driven dance had started at the time of the announcement of the new Computing curriculum in England, when she realised the lack of gender balance in her computing classroom. As an expert in both ballet and computing, she was driven by a desire to share the more creative elements of computing with her learners.
Genevieve has been working with a technologist and a choreographer for several years to develop ballets that generate biometric data and include visualisation of such data — hence her term ‘data-driven dance’. This has led to her developing a second focus in her PhD work on how Computing students can discuss questions of ethics based on the kind of biometric and brainwave data that Genevieve is collecting in her research. Students need to learn about the ethical issues surrounding data as part of their Computing studies, and Genevieve has been working with student teachers to explore ways in which her research can be used to give examples of data ethics issues in the Computing curriculum.
Throughout her talk, Genevieve described several examples of dances she had created. One example was [arra]stre, a project that involved a live performance of a dance, plus a series of workshops breaking down the computer science theory behind the performance, including data visualisation, wearable technology, and images triggered by the dancers’ data.
Much of Genevieve’s seminar was focused on the technologies used to capture movement data from the dancers and the challenges this involves. For example, some existing biometric tools don’t capture foot movement — which is crucial in dance — and also can’t capture movements when dancers are in the air. For some of Genevieve’s projects, dancers also wear headsets that allow collection of brainwave data.
Due to interruptions to her research design caused by the COVID-19 pandemic, much of Genevieve’s PhD research took place online via video calls. New tools had to be created to capture dance performances within a digital online setting. Her research uses webcams and mobile phones to record the biometric data of dancers at 60 frames per second. A number of processes are then followed to create a digital representation of the dance: isolating the dancer in the raw video; tracking the skeleton data; using post pose estimation machine learning algorithms; and using additional software to map the joints to the correct place and rotation.
It’s clear from Genevieve’s research that she is collecting a lot of data from her research participants, particularly the dancers. The projects include collecting both biometric data and brainwave data. Ethical issues tied to brainwave data are part of the field of neuroethics, which comprises the ethical questions raised by our increasing understanding of the biology of the human brain.
Teaching learners to be mindful about how to work with personal data is at the core of the work that Genevieve is doing now. She mentioned that there are a number of ethics frameworks that can be used in this area, and highlighted the UK government’s Data Ethics Framework as being particularly straightforward with its three guiding principles of transparency, accountability, and fairness. Frameworks such as this can help to guide a classroom discussion around the security of the data, and whether the data can be used in discriminatory ways.
Data ethics provides lots of material for discussion in Computing classrooms. To exemplify this, Genevieve recorded her own brainwaves during dance, research, and rest activities, and then shared the data during workshops with student computing teachers. In our seminar Genevieve showed two visualisations of her own brainwave data (see the images above) and discussed how the student computing teachers in her workshops had felt that one was more “personal” than the other. The same brainwave data can be presented as a spreadsheet, or a moving graph, or an image. Student computing teachers felt that the graph data (shown above) felt more medical, and more like permanent personal data than the visualisation (shown above), but that the actual raw spreadsheet data felt the most personal and intrusive.
Watch the recording of Genevieve’s seminar to see her full talk:
You can also access her slides and the links she shared in her talk.
There are a variety of online tools you can use to explore augmented reality: for example try out Posenet with the camera of your device.
Genevieve’s seminar used the title ME++, which refers to the data self and the human self: both are important and of equal value. Genevieve’s use of this term is inspired by William J. Mitchell’s book Me++: The Cyborg Self and the Networked City. Within his framing, the I in the digital world is more than the I of the physical world and highlights the posthuman boundary-blurring of the human and non-human.
Genevieve’s work is also inspired by Luciani Floridi’s philosophical work, and his book Ethics of Information might be something you want to investigate further. You can also read ME++ Data Ethics of Biometrics Through Ballet and AR, a paper by Genevieve about her doctoral work
In our final two seminars for this year we are exploring further aspects of cross-disciplinary computing. Just this week, Conrad Wolfram of Wolfram Technologies joined us to present his ideas on maths and a core computational curriculum. We will share a summary and recording of his talk soon.
On 8 November, Tracy Gardner and Rebecca Franks from the Raspberry Pi Foundation team will close out this series by presenting work we have been doing on computing education in non-formal settings. Sign up now to join us for this session:
We will shortly be announcing the theme of a brand-new series of seminars starting in January 2023.
The post Data ethics for computing education through ballet and biometrics appeared first on Raspberry Pi.
We are excited to announce our second new Python learning path, ‘More Python’, which shows young coders how to add real data to their programs while creating projects from a chart of Olympic medals to an interactive world map. The six guided Python projects in this free learning path are designed to enable young people to independently create their own Python projects about the topics that matter to them.
In this post, we’ll show you how kids use the projects in the ‘More Python’ path, what they can make by following the path, and how the path structure helps them become confident and independent digital makers.
Our ‘Introduction to Python’ learning path is the perfect place to start learning how to use Python, a text-based programming language. When we launched the Intro path in February, we explained why Python is such a popular, useful, and accessible programming language for young people.
Because Python has so much to offer, we have created a second Python path for young people who have learned the basics in the first path. In this new set of six projects, learners will discover new concepts and see how to add different types of real data to their programs.
We have written the projects in this path with young people around the age of 10 to 13 in mind. To code in a text-based language, a young person needs to be familiar with using a keyboard, due to the typing involved. Learners should have already completed the ‘Introduction to Python’ project path, as they will build on the learning from that path.
Young people need access to a web browser to complete our project paths. Each project contains step-by-step instructions for learners to follow, and tick boxes to mark when they complete each step. On top of that, the projects have steps for learners to:
Young people also have the option to sign up for an account with us so they can save their progress at any time and collect badges.
While learners follow the project instructions in this project path, they write their code into Trinket, a free web-based coding platform accessible in a browser. Each project contains a link to a starter Trinket, which includes everything to get started writing Python code — no need to install any additional software.
If they prefer, however, young people also have the option of instead writing their code in a desktop-based programming environment, such as Thonny, as they work through the projects.
To use data in their Python programs, the project instructions show learners how to:
The projects support learners as they explore new concepts of digital visual media and:
In each project, learners reflect and answer questions about their work, which is important for connecting the project’s content to their pre-existing knowledge.
As they work through the projects, learners see different ways to present data and then decide how they want to present their data in the final project in the path. You’ll find out what the projects are on the path page, or at the bottom of this blog post.
The project path helps learners become independent coders and digital makers, as each project contains slightly less support than the one before. You can read about how our project paths are designed to increase young people’s independence, and explore our other free learning paths for young coders
We’ve designed the path to be completed in around six one-hour sessions, with one hour per project, at home, in school, or at a coding club. The project instructions encourage learners to add code to upgrade their projects and go further if they wish. This means that young people might want to spend a little more time getting their projects exactly as they imagine them.
Unity is a free development environment for creating 3D virtual environments, including games, visual novels, and animations, all with the text-based programming language C#. Our ‘Introduction to Unity’ project path for keen coders shows how to make 3D worlds and games with collectibles, timers, and non-player characters.
At the end of the ‘More Python’ path, learners are encouraged to register a project they’ve made using their new coding skills for Coolest Projects Global, our free and world-leading online technology showcase for young tech creators. The project they register will become part of the online gallery, where members of the Coolest Projects community can celebrate each other’s creations.
We welcome projects from all young people, whether they are beginners or experienced coders and digital makers. Coolest Projects Global is a unique opportunity for young people to share their ingenuity with the world and with other young people who love coding and creating with digital technology.
The post Python coding for kids: Moving beyond the basics appeared first on Raspberry Pi.
At the Raspberry Pi Foundation, we’ve been thinking about questions relating to artificial intelligence (AI) education and data science education for several months now, inviting experts to share their perspectives in a series of very well-attended seminars. At the same time, we’ve been running a programme of research trials to find out what interventions in school might successfully improve gender balance in computing. We’re learning a lot, and one primary lesson is that these topics are not discrete: there are relationships between them.
We can’t talk about AI education — or computer science education more generally — without considering the context in which we deliver it, and the societal issues surrounding computing, AI, and data. For this International Women’s Day, I’m writing about the intersection of AI and gender, particularly with respect to gender bias in machine learning.
Gender inequality is everywhere, and researchers, activists, and initiatives, and governments themselves, have struggled since the 1960s to tackle it. As women and girls around the world continue to suffer from discrimination, the United Nations has pledged, in its Sustainable Development Goals, to achieve gender equality and to empower all women and girls.
While progress has been made, new developments in technology may be threatening to undo this. As Susan Leavy, a machine learning researcher from the Insight Centre for Data Analytics, puts it:
Artificial intelligence is increasingly influencing the opinions and behaviour of people in everyday life. However, the over-representation of men in the design of these technologies could quietly undo decades of advances in gender equality.
Susan Leavy, 2018 [1]
In her 2019 award-winning book Invisible Women: Exploring Data Bias in a World Designed for Men [2], Caroline Criado Perez discusses the effects of gender-biased data. She describes, for example, how the designs of cities, workplaces, smartphones, and even crash test dummies are all based on data gathered from men. She also discusses that medical research has historically been conducted by men, on male bodies.
Looking at this problem from a different angle, researcher Mayra Buvinic and her colleagues highlight that in most countries of the world, there are no sources of data that capture the differences between male and female participation in civil society organisations, or in local advisory or decision making bodies [3]. A lack of data about girls and women will surely impact decision making negatively.
Machine learning (ML) is a type of artificial intelligence technology that relies on vast datasets for training. ML is currently being use in various systems for automated decision making. Bias in datasets for training ML models can be caused in several ways. For example, datasets can be biased because they are incomplete or skewed (as is the case in datasets which lack data about women). Another example is that datasets can be biased because of the use of incorrect labels by people who annotate the data. Annotating data is necessary for supervised learning, where machine learning models are trained to categorise data into categories decided upon by people (e.g. pineapples and mangoes).
In order for a machine learning model to categorise new data appropriately, it needs to be trained with data that is gathered from everyone, and is, in the case of supervised learning, annotated without bias. Failing to do this creates a biased ML model. Bias has been demonstrated in different types of AI systems that have been released as products. For example:
Facial recognition: AI researcher Joy Buolamwini discovered that existing AI facial recognition systems do not identify dark-skinned and female faces accurately. Her discovery, and her work to push for the first-ever piece of legislation in the USA to govern against bias in the algorithms that impact our lives, is narrated in the 2020 documentary Coded Bias.
Natural language processing: Imagine an AI system that is tasked with filling in the missing word in “Man is to king as woman is to X” comes up with “queen”. But what if the system completes “Man is to software developer as woman is to X” with “secretary” or some other word that reflects stereotypical views of gender and careers? AI models called word embeddings learn by identifying patterns in huge collections of texts. In addition to the structural patterns of the text language, word embeddings learn human biases expressed in the texts. You can read more about this issue in this Brookings Institute report.
There is much debate about the level of bias in systems using artificial intelligence, and some AI researchers worry that this will cause distrust in machine learning systems. Thus, some scientists are keen to emphasise the breadth of their training data across the genders. However, other researchers point out that despite all good intentions, gender disparities are so entrenched in society that we literally are not aware of all of them. White and male dominance in our society may be so unconsciously prevalent that we don’t notice all its effects.
As sociologist Pierre Bourdieu famously asserted in 1977: “What is essential goes without saying because it comes without saying: the tradition is silent, not least about itself as a tradition.” [4]. This view holds that people’s experiences are deeply, or completely, shaped by social conventions, even those conventions that are biased. That means we cannot be sure we have accounted for all disparities when collecting data.
Developers and researchers of AI systems have been trying to establish rules for how to avoid bias in AI models. An example rule set is given in an article in the Harvard Business Review, which describes the fact that speech recognition systems originally performed poorly for female speakers as opposed to male ones, because systems analysed and modelled speech for taller speakers with longer vocal cords and lower-pitched voices (typically men).
The article recommends four ways for people who work in machine learning to try to avoid gender bias:
The above points can help people in the AI industry, which is of course important — but what about the rest of us? It’s important to raise awareness of the issues around gender data bias and AI lest we find out too late that we are reintroducing gender inequalities we have fought so hard to remove. Awareness is a good start, and some other suggestions, drawn out from others’ work in this area are:
Having more women in AI and data science, particularly in both technical and leadership roles, will help to reduce gender bias. A 2020 report by the World Economic Forum (WEF) on gender parity found that women account for only 26% of data and AI positions in the workforce. The WEF suggests five ways in which the AI workforce gender balance could be addressed:
We need high-quality dataset on women and girls, with good coverage, including country coverage. Data needs to be comparable across countries in terms of concepts, definitions, and measures. Data should have both complexity and granularity, so it can be cross-tabulated and disaggregated, following the recommendations from the Data2x project on mapping gender data gaps.
At the Raspberry Pi Foundation we believe that introducing some of the potential (positive and negative) impacts of AI systems to young people through their school education may help to build awareness and understanding at a young age. The jury is out on what exactly to teach in AI education, and how to teach it. But we think educating young people about new and future technologies can help them to see AI-related work opportunities as being open to all, and to develop critical and ethical thinking.
In our AI education seminars we heard a number of perspectives on this topic, and you can revisit the videos, presentation slides, and blog posts. We’ve also been curating a list of resources that can help to further AI education — although there is a long way to go until we understand this area fully.
We’d love to hear your thoughts on this topic.
References
[1] Leavy, S. (2018). Gender bias in artificial intelligence: The need for diversity and gender theory in machine learning. Proceedings of the 1st International Workshop on Gender Equality in Software Engineering, 14–16.
[2] Perez, C. C. (2019). Invisible Women: Exploring Data Bias in a World Designed for Men. Random House.
[3] Buvinic M., Levine R. (2016). Closing the gender data gap. Significance 13(2):34–37
[4] Bourdieu, P. (1977). Outline of a Theory of Practice (No. 16). Cambridge University Press. (p.167)
The post Bias in the machine: How can we address gender bias in AI? appeared first on Raspberry Pi.
In Hello World issue 12, our free magazine for computing educators, George Boukeas, DevOps Engineer for the Astro Pi Challenge here at the Foundation, introduces big moments in the history of artificial intelligence (AI) to share with your learners:
The story of artificial intelligence (AI) is a story about humans trying to understand what makes them human. Some of the episodes in this story are fascinating. These could help your learners catch a glimpse of what this field is about and, with luck, compel them to investigate further.
In 1950, Alan Turing published a philosophical essay titled Computing Machinery and Intelligence, which started with the words: “I propose to consider the question: Can machines think?” Yet Turing did not attempt to define what it means to think. Instead, he suggested a game as a proxy for answering the question: the imitation game. In modern terms, you can imagine a human interrogator chatting online with another human and a machine. If the interrogator does not successfully determine which of the other two is the human and which is the machine, then the question has been answered: this is a machine that can think.
This imitation game is now a fiercely debated benchmark of artificial intelligence called the Turing test. Notice the shift in focus that Turing suggests: thinking is to be identified in terms of external behaviour, not in terms of any internal processes. Humans are still the yardstick for intelligence, but there is no requirement that a machine should think the way humans do, as long as it behaves in a way that suggests some sort of thinking to humans.
In his essay, Turing also discusses learning machines. Instead of building highly complex programs that would prescribe every aspect of a machine’s behaviour, we could build simpler programs that would prescribe mechanisms for learning, and then train the machine to learn the desired behaviour. Turing’s text provides an excellent metaphor that could be used in class to describe the essence of machine learning: “Instead of trying to produce a programme to simulate the adult mind, why not rather try to produce one which simulates the child’s? If this were then subjected to an appropriate course of education one would obtain the adult brain. We have thus divided our problem into two parts: the child-programme and the education process.”
It is remarkable how Turing even describes approaches that have since been evolved into established machine learning methods: evolution (genetic algorithms), punishments and rewards (reinforcement learning), randomness (Monte Carlo tree search). He even forecasts the main issue with some forms of machine learning: opacity. “An important feature of a learning machine is that its teacher will often be very largely ignorant of quite what is going on inside, although he may still be able to some extent to predict his pupil’s behaviour.”
The term ‘artificial intelligence’ was coined in 1956, at an event called the Dartmouth workshop. It was a gathering of the field’s founders, researchers who would later have a huge impact, including John McCarthy, Claude Shannon, Marvin Minsky, Herbert Simon, Allen Newell, Arthur Samuel, Ray Solomonoff, and W.S. McCulloch.
The simple and ambitious definition for artificial intelligence, included in the proposal for the workshop, is illuminating: ‘making a machine behave in ways that would be called intelligent if a human were so behaving’. These pioneers were making the assumption that ‘every aspect of learning or any other feature of intelligence can in principle be so precisely described that a machine can be made to simulate it’. This assumption turned out to be patently false and led to unrealistic expectations and forecasts. Fifty years later, McCarthy himself stated that ‘it was harder than we thought’.
Modern definitions of intelligence are of distinctly different flavour than the original one: ‘Intelligence is the quality that enables an entity to function appropriately and with foresight in its environment’ (Nilsson). Some even speak of rationality, rather than intelligence: ‘doing the right thing, given what it knows’ (Russell and Norvig).
In the full article, which you can read in the free PDF copy of the issue, George looks at:
In your free PDF of Hello World issue 12, you’ll also find:
You can also read many of these articles online on the Hello World website.
In Hello World issue 16, the focus is on all things data science and data literacy for your learners. As always, you can download a free copy of the issue. And on our Hello World podcast, we chat with practicing computing educators about how they bring AI, AI ethics, machine learning, and data science to the young people they teach.
If you want a practical introduction to the basics of machine learning and how to use it, take our free online course.
There are still many open questions about what good AI and data science education looks like for young people. To learn more, you can watch our panel discussion about the topic, and join our monthly seminar series to hear insights from computing education researchers around the world.
We are also collating a growing list of educational resources about these topics based on our research seminars, seminar participants’ recommendations, and our own work. Find the resource list here.
The post Snapshots from the history of AI, plus AI education resources appeared first on Raspberry Pi.
Between September 2021 and March 2022, we’re partnering with The Alan Turing Institute to host a series of free research seminars about how to teach AI and data science to young people.
In the second seminar of the series, we were excited to hear from Professor Carsten Schulte, Yannik Fleischer, and Lukas Höper from the University of Paderborn, Germany, who presented on the topic of teaching AI and machine learning (ML) from a data-centric perspective. Their talk raised the question of whether and how AI and ML should be taught differently from other themes in the computer science curriculum at school.
The rationale behind the speakers’ work is a concept they call hybrid interaction system, referring to the way that humans and machines interact. To explain this concept, Carsten referred to a 2019 article published in Nature by Iyad Rahwan and colleagues: Machine hehaviour. The article’s authors propose that the study of AI agents (complex and simple algorithms that make decisions) should be a separate, cross-disciplinary field of study, because of the ubiquity and complexity of AI systems, and because these systems can have both beneficial and detrimental impacts on humanity, which can be difficult to evaluate. (Our previous seminar by Mhairi Aitken highlighted some of these impacts.) The authors state that to study this field, we need to draw on scientific practices from across different fields, as shown below:
In establishing their argument, the authors compare the study of animal behaviour and machine behaviour, citing that both fields consider aspects such as mechanism, development, evolution and function. They describe how part of this proposed machine behaviour field may focus on studying individual machines’ behaviour, while collective machines and what they call ‘hybrid human-machine behaviour’ can also be studied. By focusing on the complexities of the interactions between machines and humans, we can think both about machines shaping human behaviour and humans shaping machine behaviour, and a sort of ‘co-behaviour’ as they work together. Thus, the authors conclude that machine behaviour is an interdisciplinary area that we should study in a different way to computer science.
Carsten and his team said that, as educators, we will need to draw on the parameters and frameworks of this machine behaviour field to be able to effectively teach AI and machine learning in school. They argue that our approach should be centred on data, rather than on code. I believe this is a challenge to those of us developing tools and resources to support young people, and that we should be open to these ideas as we forge ahead in our work in this area.
In the interpretation of computational thinking popularised in 2006 by Jeanette Wing, she introduces computational thinking as being about ‘ideas, not artefacts’. When we, the computing education community, started to think about computational thinking, we moved from focusing on specific technology — and how to understand and use it — to the ideas or principles underlying the domain. The challenge now is: have we gone too far in that direction?
Carsten argued that, if we are to understand machine behaviour, and in particular, human-machine co-behaviour, which he refers to as the hybrid interaction system, then we need to be studying artefacts as well as ideas.
Throughout the seminar, the speakers reminded us to keep in mind artefacts, issues of bias, the role of data, and potential implications for the way we teach.
In addition, Carsten highlighted a number of differences between learning ML and learning other areas of computer science, including traditional programming:
These differences imply that our teaching should adapt too.
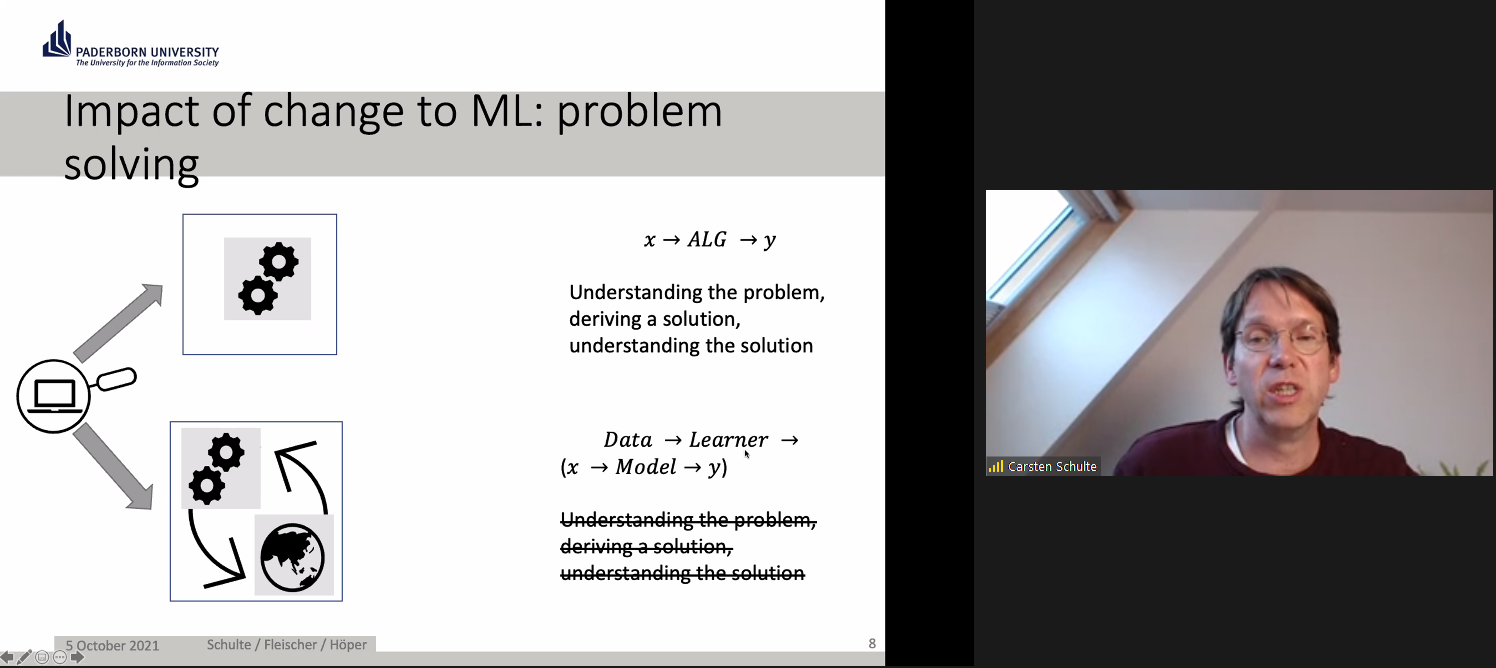
In Germany, education is devolved to state governments. Although computer science (known as informatics) was only last year introduced as a mandatory subject in lower secondary schools in North Rhine-Westphalia, where Paderborn is located, it has been taught at the upper secondary levels for many years. ProDaBi is a project that researchers have been running at Paderborn University since 2017, with the aim of developing a secondary school curriculum around data science, AI, and ML.
The ProDaBi curriculum includes:
Although the ProDaBi project site is in German, an English translation is available.
Our speakers described example activities from three of the modules:
There was a lot to digest in this seminar: challenging ideas and some new concepts, for me anyway. An important takeaway for me was how much we do not yet know about the concepts and skills we should be teaching in school around AI and ML, and about the approaches that we should be using to teach them effectively. Research such as that being carried out in Paderborn, demonstrating a data-centric approach, can really augment our understanding, and I’m looking forward to following the work of Carsten and his team.
Carsten and colleagues ended with this summary and discussion point for the audience:
“‘AI education’ requires developing an adequate picture of the hybrid interaction system — a kind of data-driven, emergent ecosystem which needs to be made explicitly to understand the transformative role as well as the technological basics of these artificial intelligence tools and how they are related to data science.”
You can catch up on the seminar, including the Q&A with Carsten and his colleagues, here:
This seminar really extended our thinking about AI education, and we look forward to introducing new perspectives from different researchers each month. At our next seminar on Tuesday 2 November at 17:00–18:30 BST / 12:00–13:30 EDT / 9:00–10:30 PDT / 18:00–19:30 CEST, we will welcome Professor Matti Tedre and Henriikka Vartiainen (University of Eastern Finland). The two Finnish researchers will talk about emerging trajectories in ML education for K-12. We look forward to meeting you there.
Carsten and their colleagues are also running a series of seminars on AI and data science: you can find out about these on their registration page.
You can increase your own understanding of machine learning by joining our latest free online course!
[1] Rahwan, I., Cebrian, M., Obradovich, N., Bongard, J., Bonnefon, J. F., Breazeal, C., … & Wellman, M. (2019). Machine behaviour. Nature, 568(7753), 477-486.
The post Should we teach AI and ML differently to other areas of computer science? A challenge appeared first on Raspberry Pi.
A recent Forbes article reported that over the last four years, the use of artificial intelligence (AI) tools in many business sectors has grown by 270%. AI has a history dating back to Alan Turing’s work in the 1940s, and we can define AI as the ability of a digital computer or computer-controlled robot to perform tasks commonly associated with intelligent beings.
Four key areas of AI are machine learning, robotics, computer vision, and natural language processing. Other advances in computing technology mean we can now store and efficiently analyse colossal amounts of data (big data); consequently, data science was formed as an interdisciplinary field combining mathematics, statistics, and computer science. Data science is often presented as intertwined with machine learning, as data scientists commonly use machine learning techniques in their analysis.
AI and data science have recently received huge amounts of attention in the media, as machine learning systems are now used to make decisions in areas such as healthcare, finance, and employment. These AI technologies cause many ethical issues, for example as explored in the film Coded Bias. This film describes the fallout of researcher Joy Buolamwini’s discovery that facial recognition systems do not identify dark-skinned faces accurately, and her journey to push for the first-ever piece of legislation in the USA to govern against bias in the algorithms that impact our lives. Many other ethical issues concerning AI exist and, as highlighted by UNESCO’s examples of AI’s ethical dilemmas, they impact each and every one of us.
So how do such advances in technology impact the education of young people? In the UK, a recent Royal Society report on machine learning recommended that schools should “ensure that key concepts in machine learning are taught to those who will be users, developers, and citizens” — in other words, every child. The AI Roadmap published by the UK AI Council in 2020 declared that “a comprehensive programme aimed at all teachers and with a clear deadline for completion would enable every teacher confidently to get to grips with AI concepts in ways that are relevant to their own teaching.” As of yet, very few countries have incorporated any study of AI and data science in their school curricula or computing programmes of study.
Here at the Raspberry Pi Foundation, AI, machine learning, and data science are important topics both in our learning resources for young people and educators, and in our programme of research. So we are delighted to announce that starting this autumn we are hosting six free, online seminars on the topic of AI, machine learning, and data science education, in partnership with The Alan Turing Institute.
The Alan Turing Institute is the UK’s national institute for data science and artificial intelligence and does pioneering work in data science research and education. The Institute conducts many different strands of research in this area and has a special interest group focused on data science education. As such, our partnership around the seminar series enables us to explore our mutual interest in the needs of young people relating to these technologies.
This promises to be an outstanding series drawing from international experts who will share examples of pedagogic best practice […].
Dr Matt Forshaw, The Alan Turing Institute
Dr Matt Forshaw, National Skills Lead at The Alan Turing Institute and Senior Lecturer in Data Science at Newcastle University, says: “We are delighted to partner with the Raspberry Pi Foundation to bring you this seminar series on AI, machine learning, and data science. This promises to be an outstanding series drawing from international experts who will share examples of pedagogic best practice and cover critical topics in education, highlighting ethical, fair, and safe use of these emerging technologies.”
At our computing education research seminars, we hear from a range of experts in the field and build an international community of researchers, practitioners, and educators interested in this important area. Our new free series of seminars runs from September 2021 to February 2022, with some excellent and inspirational speakers:
All seminars start at 17:00 UK time (18:00 Central European Time, 12 noon Eastern Time, 9:00 Pacific Time) and take place in an online format, with a presentation, breakout discussion groups, and a whole-group Q&A.
Sign up now and we’ll send you the link to join on the day of each seminar — don’t forget to put the dates in your diary!
In the meantime, you can explore some of our educational resources related to machine learning and data science:
The post Educating young people in AI, machine learning, and data science: new seminar series appeared first on Raspberry Pi.
In our brand-new issue of Hello World magazine, editor Gemma Coleman speaks to Kate Farrell from Data Education in Schools to discuss the importance of teaching data to help students navigate the world.
When I was searching for contributors for this issue of Hello World, a pattern quickly began to emerge: “Data? You want to speak to Kate.” Kate Farrell is director of curriculum development and professional learning on the Data Education in Schools project, part of the Data-Driven Innovation Skills Gateway in Scotland. With the project developing teaching materials, professional development, and even qualifications for schools that want to teach data education to learners aged 3–18, “It’s not the kind of role that fits easily on a business card,” she laughs.
The project started in 2019, with the team looking at the Scottish curriculum and mapping out where data could be embedded and how it could be used to support various subjects. “We know that teachers are under stress and won’t be able to deliver extra stuff, so we’re looking to understand how we get better at doing data literacy within the rest of the curriculum,” Kate explains. “How do we provide and support opportunities to look at data in the rest of the curriculum in cool new ways?”
“We like taking topics that you wouldn’t instantly think are about data science.”
The team runs monthly seminars drawing upon this theme, to help teachers see its applicability across all subjects. “We like taking topics that you wouldn’t instantly think are about data science. Yes, the sciences, computer science, and maths are where you would expect it, but there are huge amounts of data and data use in geography, music, social studies, and even PE.”
One example is the DataFit series of lessons for upper primary and lower secondary students, with a mission to simultaneously increase data literacy and physical activity literacy. This includes an introduction to activity-monitoring devices, such as step counters on phones. The lesson has the twin aims of teaching students how monitoring steps or sleep activity can be a positive thing, and also encouraging them to reflect on how they feel about their phone collecting their personal data.
“A lot of students don’t realise their phone is keeping track of their step count, just by virtue of it sitting in their pockets,” Kate muses. “It’s been interesting to see just how little some learners know about the data that’s being kept and tracked about them.”
Data Education in Schools ran a similarly themed workshop for students aged 10–11, with a series of events in an imagined Data Town being examined, to investigate how data can impact our lives. The day started by giving each student a cardboard mobile phone on which they could install apps in the form of stickers if they gave the town certain pieces of information about themselves, such as their favourite colour or football team. “Some kids would just install anything, give up any data, because they wanted the stickers – just like many kids will just download any app,” Kate explains. The apps and associated products then developed as they gathered more data, which was then presented back to the students. The purpose was to get students to reflect on how they felt about the products and how they used their data.
“[…] a series of ‘aha’ moments for students, as they realised what sharing their data meant.”
Later in the workshop, the mayor of Data Town announced that the town had sold the data to an advertising company who wanted to know people’s favourite colour, and to a gym who wanted to know their fitness data to help them decide the location of a new branch. “This meant a series of ‘aha’ moments for students, as they realised what sharing their data meant. Some of the kids who had opted not to collect the stickers were suddenly very smug!”
The project keeps a balance in the story it tells about data, with teaching materials encompassing both the risks of data collection and the huge benefits it can bring. “That is our main aim: how can we help learners use data to make their lives and the lives of their communities better — data for social good.” In the Data Town workshop, students also chose to share data with hospitals and researchers, and later found that this had helped them to develop new medicines. “We didn’t just want to send across the message that sharing data is bad. Yes, you can share your data, but be aware who you’re sharing it with, who you’re trusting with it.”
“How can we help learners use data to make their lives and the lives of their communities better?”
The materials that Data Education in Schools has produced use a framework called PPDAC: Problem, Plan, Data, Analysis, and Conclusion. This is an established approach to statistical literacy, and using this data problem-solving cycle in a real-world context is a powerful way to engage learners with data topics. “The aim is to empower students with the tools to be campaigning, to be making real-world changes to their lives and their communities using data.”
Kate gives a simple example of how a class could look at how much plastic their canteen is using, collecting the data on plastic products and then using that data to make the case to reduce their plastic consumption.
The project has also worked with Scottish exam board SQA to develop a National Progression Award in Data Science; they believe it is the world’s first data science school qualification. The award is aimed at upper secondary students, colleges, and workplaces as an introductory qualification in data science. It carries the same ethos as their materials for younger learners: to help students understand how data is used in society, both negatively and positively, and develop skills to help them make better decisions.
“We need learners to be able to look at the news, and their social media stream, and question what they’re looking at, or ask: where is the evidence?”
“I want people to realise that although data science sounds scary, it’s so important to learners’ lives these days. We’ve seen it with the pandemic. Being able to interpret and analyse data is hugely important. We need learners to be able to look at the news, and their social media stream, and question what they’re looking at, or ask: where is the evidence? This is so important, whether or not they go on to become a data scientist… although we’d love it if they did!”
Issue 16 of Hello World focuses on data science and data literacy; it is full of teaching ideas and inspiration to help you and your students use data to make decisions and to make sense of the world. Also in this issue:
Subscribe now to get each new digital issue straight to your inbox! And if you’re based in the UK and do paid or unpaid work in education, you can subscribe for free print issues.
PS Have you listened to our Hello World podcast yet? Episode 4 has just come out, and it’s great! Listen and subscribe wherever you get your podcasts.
The post How do you use data to solve a real-world problem? | Hello World #16 appeared first on Raspberry Pi.


 Lateo.net - Flux RSS en pagaille (pour en ajouter : @ moi)
